


JEE ADVANCED PREVIOUS YEAR-JEE ADVANCED 2021-QUESTION
- The reaction of Q with PhSNa yields an organic compound(major product)...
Text Solution
|
- The correct statement(s) related to colloids is(are)
Text Solution
|
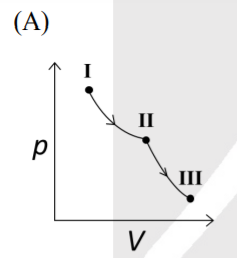
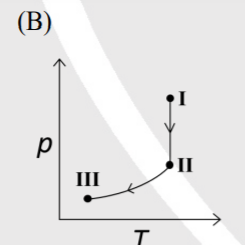
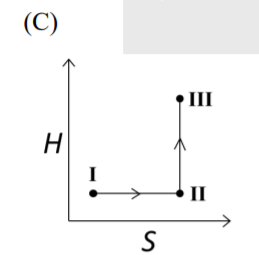
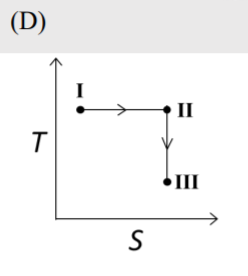
- An ideal gas undergoes a reversible isothermal expansion from state I ...
Text Solution
|
- The correct statement(s) related to the metal extraction processes is(...
Text Solution
|
- A mixture of two salts is used to prepare a solution S, which gives th...
Text Solution
|
- The maximum number of possible isomers(including stereoisomers) which ...
Text Solution
|
- In the reaction given below, the total number of atoms having sp^2 hyb...
Text Solution
|
- The total number of possible isomers for [Pt(NH3)4Cl2]Br2 is ---------...
Text Solution
|
- The reaction sequence(s) that would lead to o-xylene as the major prod...
Text Solution
|
- Correct option(s) for the following sequence of reactions is(are)
Text Solution
|
- For the following reaction 2X+Y overset(K)rarrP the rate of reacti...
Text Solution
|
- Some standard electrode potentials at 298K are given below: To a ...
Text Solution
|
- The pair(s) of complexes where in both exhibit tetrahedral geometry is...
Text Solution
|
- The correct statement(s) related to oxoacids of phosphorous is(are)
Text Solution
|
- At 298K, the limiting molar conductivity of a weak monobasic acid is 4...
Text Solution
|
- At 298K, the limiting molar conductivity of a weak monobasic acid is 4...
Text Solution
|
- Reaction of xg of Sn with HCl quantitatively produced a salt. Entire a...
Text Solution
|
- Reaction of xg of Sn with HCl quantitatively produced a salt. Entire a...
Text Solution
|
- A sample (5.6g) containing iron is completely dissolved in cold dilute...
Text Solution
|
- A sample (5.6g) containing iron is completely dissolved in cold dilute...
Text Solution
|