A
B
C
D
Text Solution
Verified by Experts
The correct Answer is:


Topper's Solved these Questions
NUCLEI
AAKASH INSTITUTE|Exercise Assignment Section D (Linked Comprehension )|9 VideosNUCLEI
AAKASH INSTITUTE|Exercise Assignment Section E (Assertion-Reason )|5 VideosNUCLEI
AAKASH INSTITUTE|Exercise Assignment Section B Objective (One option is correct )|10 VideosMOVING CHARGES AND MAGNETISM
AAKASH INSTITUTE|Exercise Assignment Section J (Aakash Challengers Questions)|5 VideosOSCILLATIONS
AAKASH INSTITUTE|Exercise Assignment (Section D) (ASSERTION-REASON TYPE QUESTIONS)|13 Videos
Similar Questions
Explore conceptually related problems
AAKASH INSTITUTE-NUCLEI-Assignment Section C Objective (More than one option are correct )
- Choose the correct alternative
Text Solution
|
- Disintegration constant of a radioactive material is lambda:
Text Solution
|
- A nucleus undergoes a series of decay according to the scheme A overse...
Text Solution
|
- A nitrogen nucleus 7^(N^(14)) absorbs a neutron and can transfrom into...
Text Solution
|
- Which of the following process represents a gamma- decay?
Text Solution
|
- The half life of a radioactive substance is T(0). At t=0,the number of...
Text Solution
|
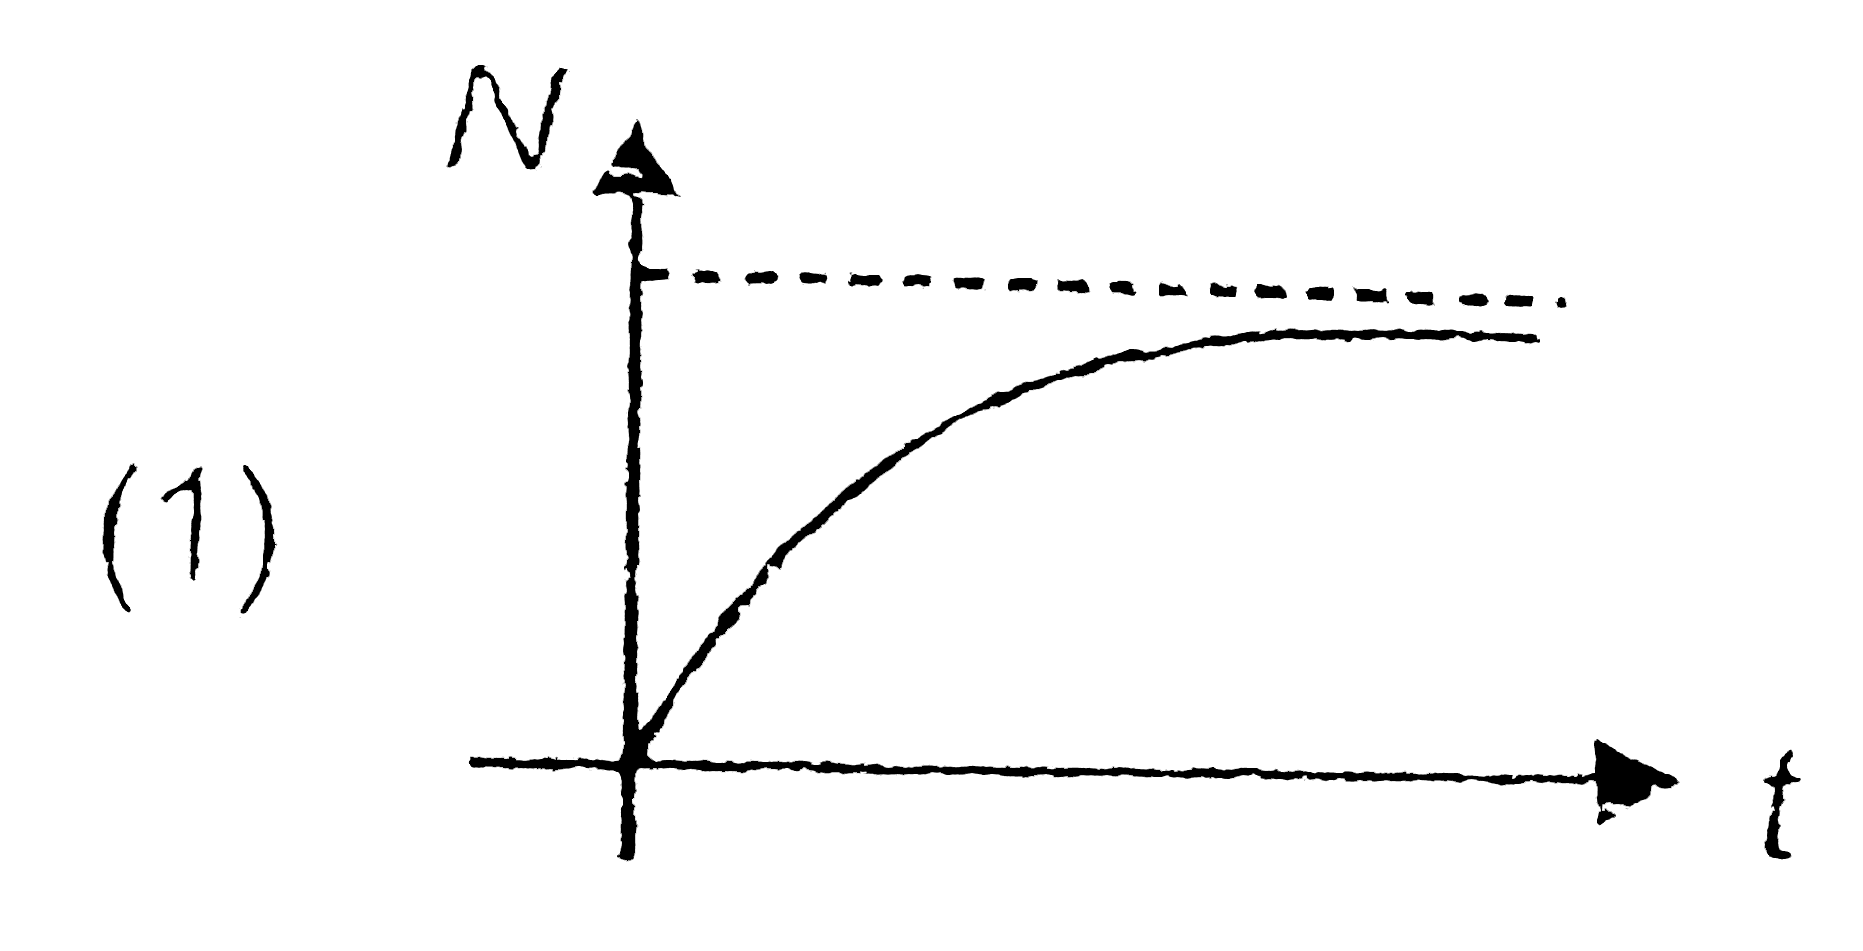
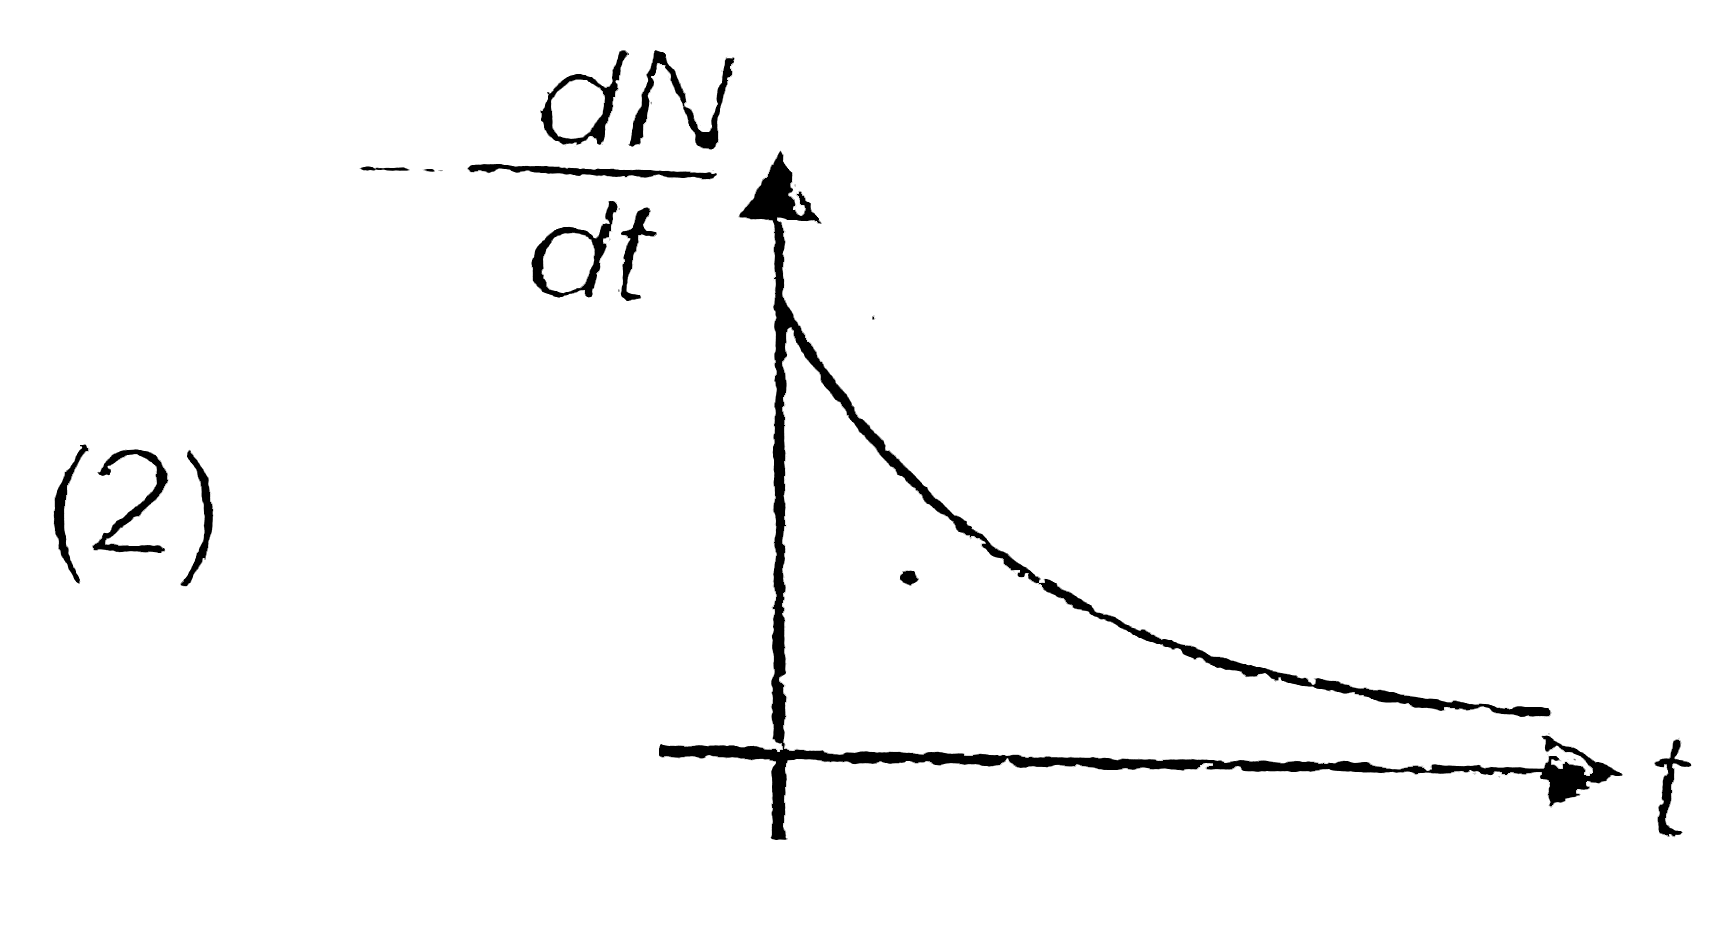
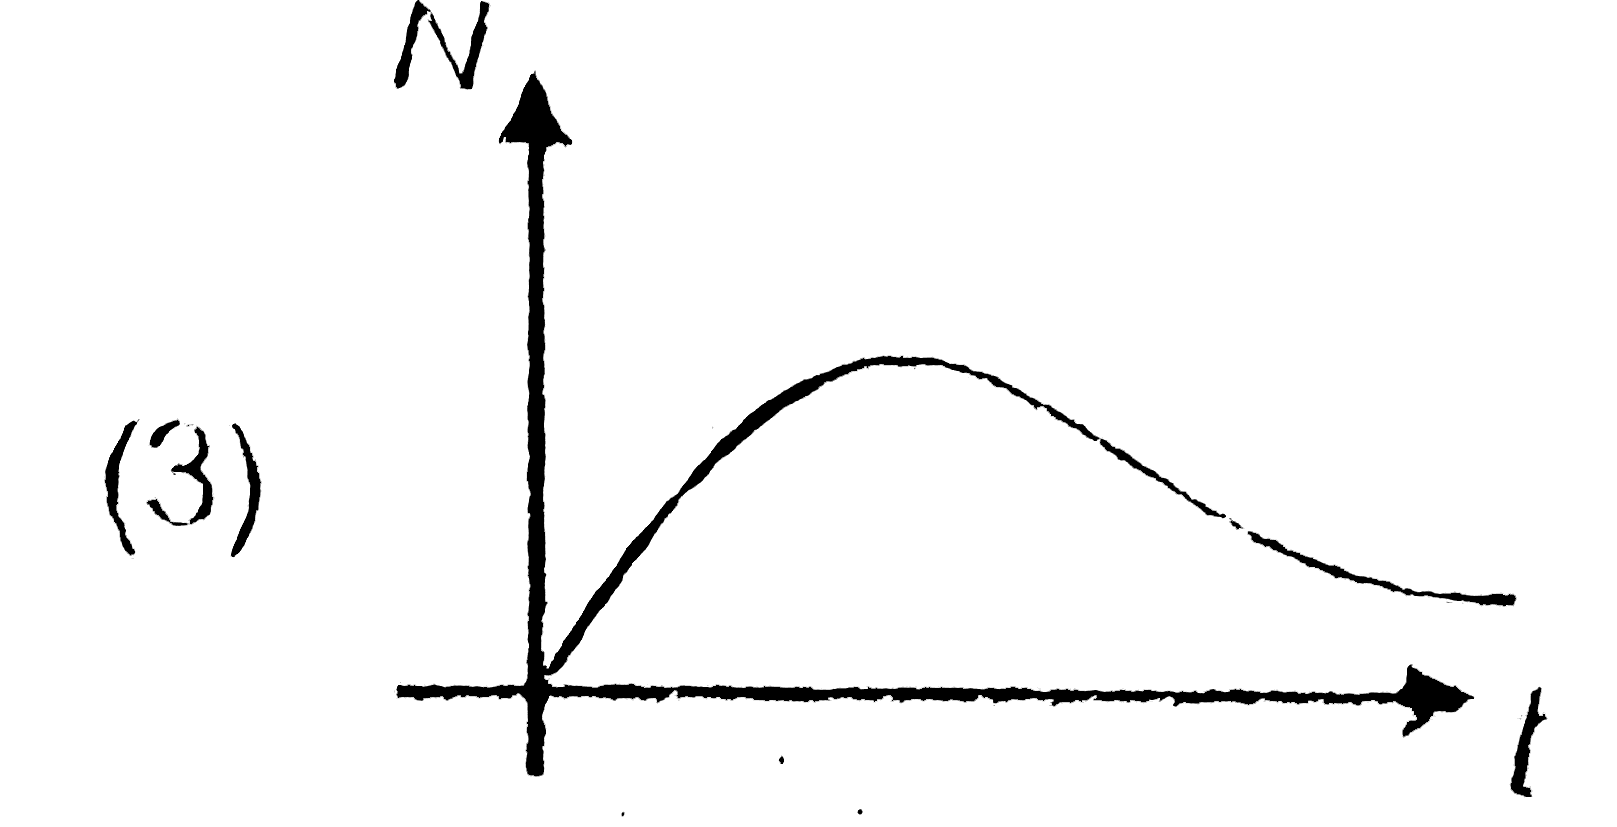
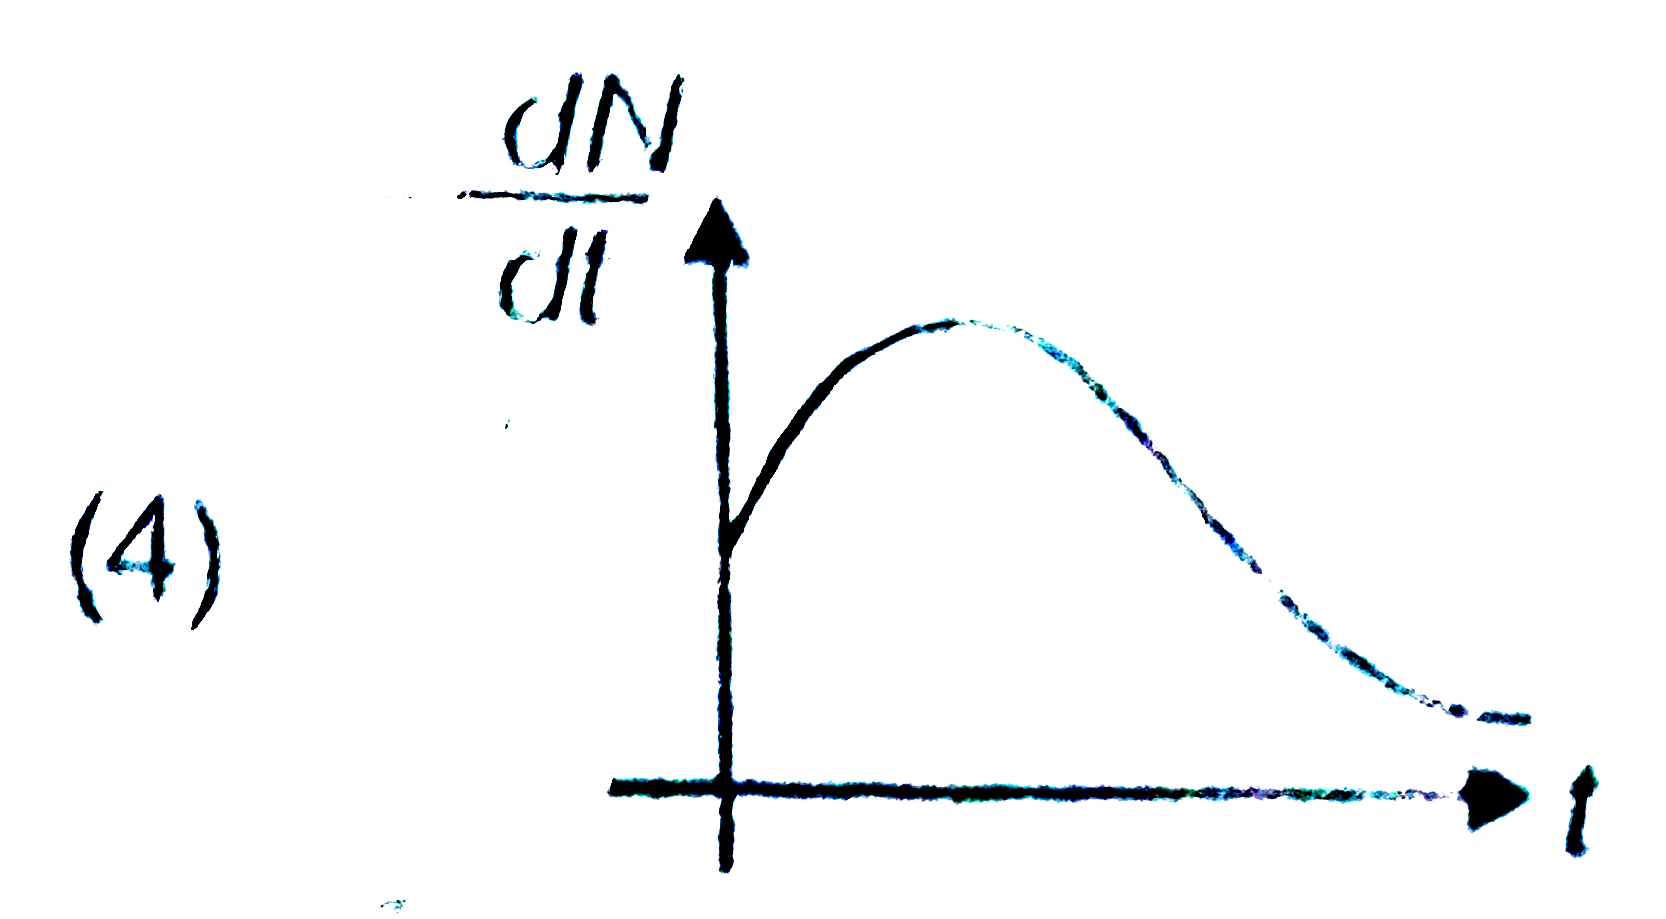
- Radioactive nuclei are being generated at a constant rate by some kind...
Text Solution
|
- The count rate of a radioactive sample was 1600 count/s at t=0 and 100...
Text Solution
|
- Which of the following is correct for a nuclear reaction ?
Text Solution
|
- The probability disintegration per second of a nucleus in a given radi...
Text Solution
|