Text Solution
Verified by Experts
The correct Answer is:
Topper's Solved these Questions
MODERN PHYSICS - 1
DC PANDEY|Exercise Level 2 Single Correct|22 VideosMODERN PHYSICS - 1
DC PANDEY|Exercise Level 2 More Than One Correct|6 VideosMODERN PHYSICS - 1
DC PANDEY|Exercise Level 1 Objective|37 VideosMODERN PHYSICS
DC PANDEY|Exercise Integer Type Questions|17 VideosMODERN PHYSICS - 2
DC PANDEY|Exercise Level 2 Subjective|10 Videos
Similar Questions
Explore conceptually related problems
DC PANDEY-MODERN PHYSICS - 1-Level 1 Subjective
- A hydrogen like atom (described by the Bohr model) is observed ot emit...
Text Solution
|
- The energy levels of a hypothetical one electron atom are shown in t...
Text Solution
|
- (a) An atom initally in an energy level with E = - 6.52 eV absorbs a ...
Text Solution
|
- A silver balll is suspended by a string in a vacuum chamber and ultrav...
Text Solution
|
- A small particle of mass m move in such a way the potential energy (U ...
Text Solution
|
- Wavelength of Kalpha line of an element is lambda0. Find wavelength o...
Text Solution
|
- x-rays are produced in an X-ray tube by electrons asselerated through ...
Text Solution
|
- From what meterial is the anod of an X-ray tube made if the Kalpha li...
Text Solution
|
- The short-wavelength limit shifts by 26 pm when the operating voltage ...
Text Solution
|
- The kalpha X-rays of aluminium (Z = 13 ) and zinc ( Z = 30) have wavel...
Text Solution
|
- Characteristic X-rays of frequency 4.2xx10^18 Hz are produced when tr...
Text Solution
|
- The electric current in an X-ray tube (from the target to the filament...
Text Solution
|
- The stopping potential for the photoelectrons emitted from a metal sur...
Text Solution
|
- What will be the maximum kinetic energy of the photoelectrons ejected ...
Text Solution
|
- A metallic surface is irradiated with monochromatic light of variable ...
Text Solution
|
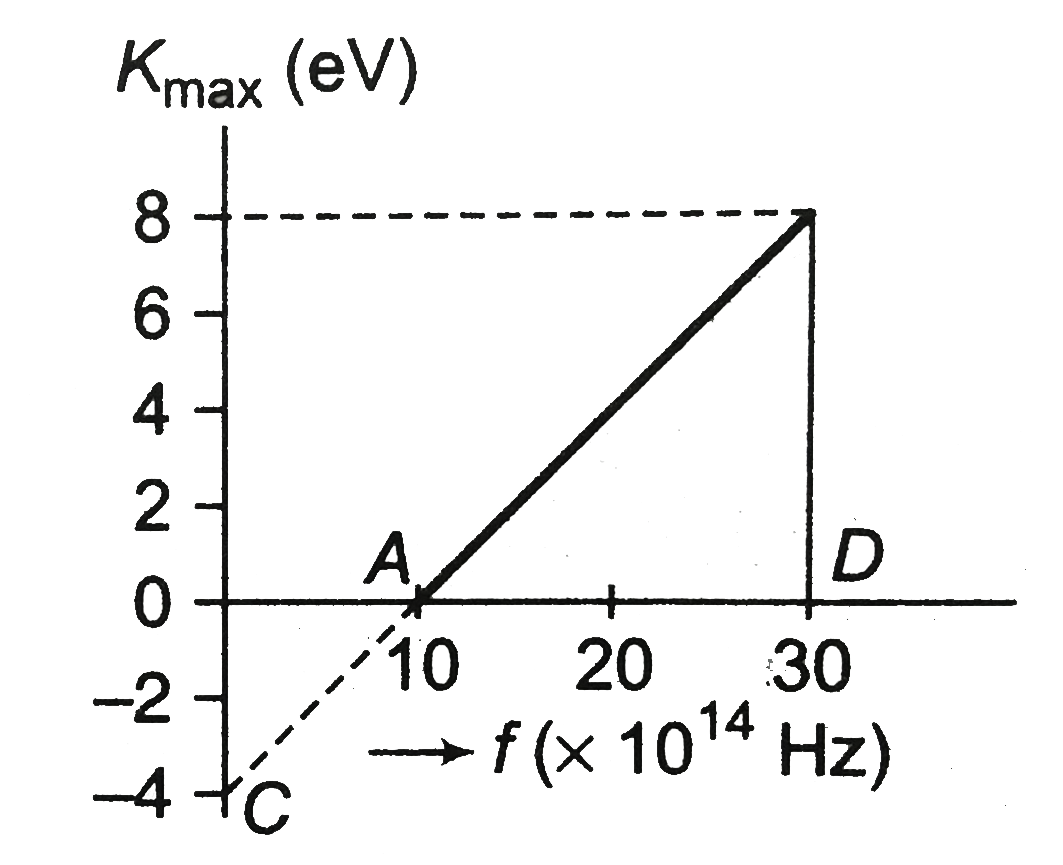
- A graph regarding photoelectric effect is shown between the maximum k...
Text Solution
|
- A metallic surface is illuminated alternatively with light of waveleng...
Text Solution
|
- Light of wavelength 180 nm ejects photoelectrons from a plate of met...
Text Solution
|
- Light described at a palce by te equation E=(100 V/m) [sinxx10^15 s...
Text Solution
|
- The electric field associated with a light wave is given by E= E0 sin...
Text Solution
|
