A
B
C
D
Text Solution
Verified by Experts
The correct Answer is:
Topper's Solved these Questions
Similar Questions
Explore conceptually related problems
NIKITA PUBLICATION-OSCILLATIONS -MCQ
- The time period of an oscillating spring of mass 630 g and spring cons...
Text Solution
|
- The length of a second's pendulum on the surface of earth is 1 m. What...
Text Solution
|
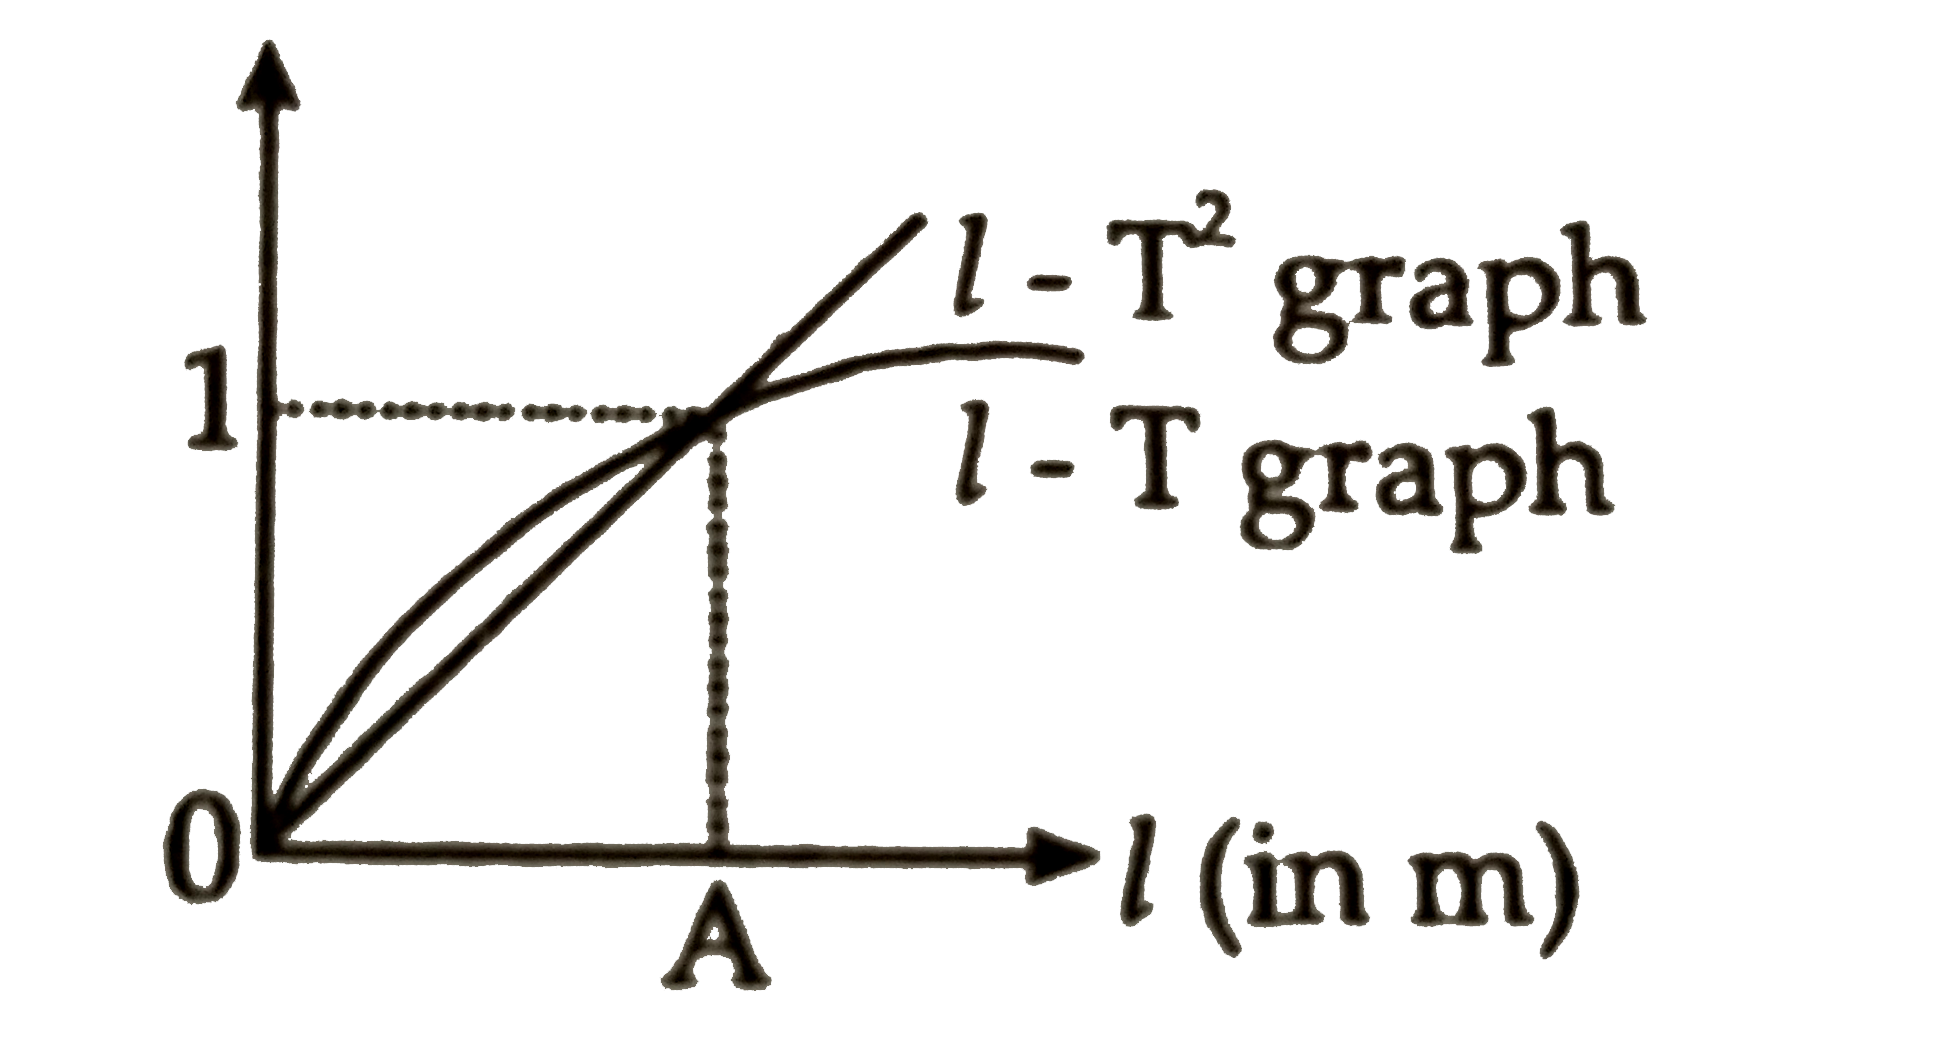
- l - T and l-T^(2) graphs of a simple pendulum on earth are as shown in...
Text Solution
|
- Time period of simple pendulum of length l at a place, where accelerat...
Text Solution
|
- The time period of a second’s pendulum is 2 sec. The spherical bob whi...
Text Solution
|
- A body has a time period (4/5) s under the action of one force and (3...
Text Solution
|
- A body has a time period (4/5) s under the action of one force and (3/...
Text Solution
|
- The length of a simple pendulum is increased by 1%. Its time period wi...
Text Solution
|
- If a simple pendulum is taken to place where g decreases by 2%, then t...
Text Solution
|
- The length of second's pendulum is increased by 21 %, then time period...
Text Solution
|
- If a pendulum clock keepds correct time at sea level is taken to a pla...
Text Solution
|
- If a pendulum clock, keeps correct time at sea level is taken to a pla...
Text Solution
|
- If the length of a second's pendulum is decreased by 0.1 %, the pendul...
Text Solution
|
- A pendulum clock, keeps correct time at sea level, when taken to a pla...
Text Solution
|
- Two pendulums have time period T and 5T/4. They starts SHM at the same...
Text Solution
|
- If the length of a seconds pendulum is increased by 2% then in a day t...
Text Solution
|
- The length of a simple pendulum is increased by 44%. The percentage in...
Text Solution
|
- A simple pendulum with a bob of mass ‘m’ oscillates from A to C and ba...
Text Solution
|
- A simple pendulum, suspended from the coiling of a lift, has a period ...
Text Solution
|
- A simple pendulum simple harmonic motion about x = 0 with an amplitude...
Text Solution
|
