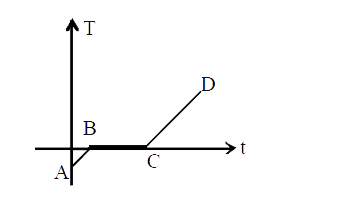
A
B
C
D
Text Solution
Verified by Experts
The correct Answer is:
Topper's Solved these Questions
HEAT - 1
MOTION|Exercise EXERCISE -3 (Level - I) Subjective | JEE Advanced|20 VideosHEAT - 1
MOTION|Exercise EXERCISE -3 (Level - II) Subjective | JEE Advanced|11 VideosHEAT - 1
MOTION|Exercise EXERCISE -2 (Level - I) Objective Problems | JEE Main|24 VideosGRAVITATION
MOTION|Exercise Exercise - 4 Section - B Previous Years Problems|15 VideosHEAT TRANSFER & THERMAL EXPANSION
MOTION|Exercise Exercise - 3 Section-B|19 Videos
Similar Questions
Explore conceptually related problems
MOTION-HEAT - 1-EXERCISE -2 (Level - II) Multiple Correct | JEE Advanced
- Heat is supplied to a ice at a constant rate Temperature variation wit...
Text Solution
|
- A solid is heated up and DeltaH vs Delta theta (DeltaH : Heat given, D...
Text Solution
|
- The heat capacity of a body depends on
Text Solution
|
- If heat is supplied to a solid its temperature (i) must increase (...
Text Solution
|
- The temperature of a solid object is observed to be constant during a ...
Text Solution
|
- In steady state–
Text Solution
|
- Figure shows a horizontal cross section (top view) of a square room su...
Text Solution
|
- Two metal cubes with 3 cm edges of copper and aluminium are arranged a...
Text Solution
|
- When two bodies at different temperature are kept in contact. Net heat...
Text Solution
|
- For transmission of heat from one place to the other medium is requir...
Text Solution
|
- The amount of heat energy radiated per second by a surface depends upo...
Text Solution
|
- Which of the following statements is correct ?
Text Solution
|
- Two sphere of same radius and material, one solid and one hollow are h...
Text Solution
|
- Figure shows variation of intensity per unit wavelength (Radiance) wit...
Text Solution
|
- Intensity versus wavelength graph for the radiation coming from two bl...
Text Solution
|
- black body and a silver polished body of same heat capacity and of sam...
Text Solution
|
