


RS AGGARWAL-PICTOGRAPH -EXERCISE 23
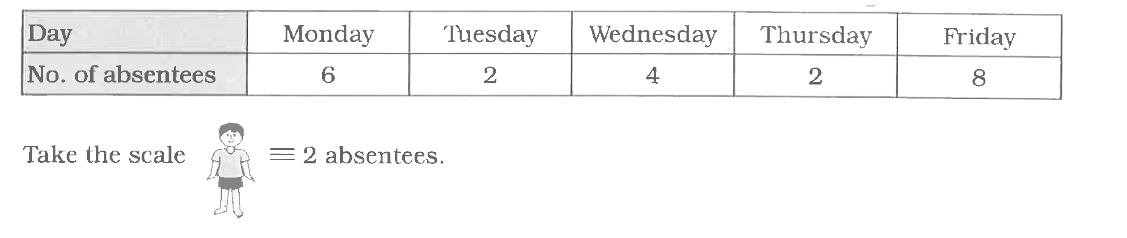
- The number of students who absented from the class cluring a week are ...
Text Solution
|
- The number of stools in five rooms of a school are gien below:
Text Solution
|
- In a class test, the number of students passed in vartous subjects are...
Text Solution
|
- The number of fans sold by a shopkeeper during 6 months are given belo...
Text Solution
|
- The following pictograph show different kinds of trees planted in a pa...
Text Solution
|
- The pictograph shws different kinds of trees planted in a park. Each s...
Text Solution
|