A
B
C
D
Text Solution
Verified by Experts
The correct Answer is:


Topper's Solved these Questions
TEST PAPERS
BANSAL|Exercise Physics, SECTION-1 (PART-A) [COMPREHENSION TYPE]|2 VideosTEST PAPERS
BANSAL|Exercise Physics, SECTION-1 (PART-A) [MULTIPLE CORRECT CHOICE TYPE]|5 VideosTEST PAPERS
BANSAL|Exercise MATHS|60 VideosPROBABILITY
BANSAL|Exercise All Questions|1 VideosTHERMODYNAMICS
BANSAL|Exercise Match the column|7 Videos
Similar Questions
Explore conceptually related problems
BANSAL-TEST PAPERS-Physics, SECTION-1 (PART-A)
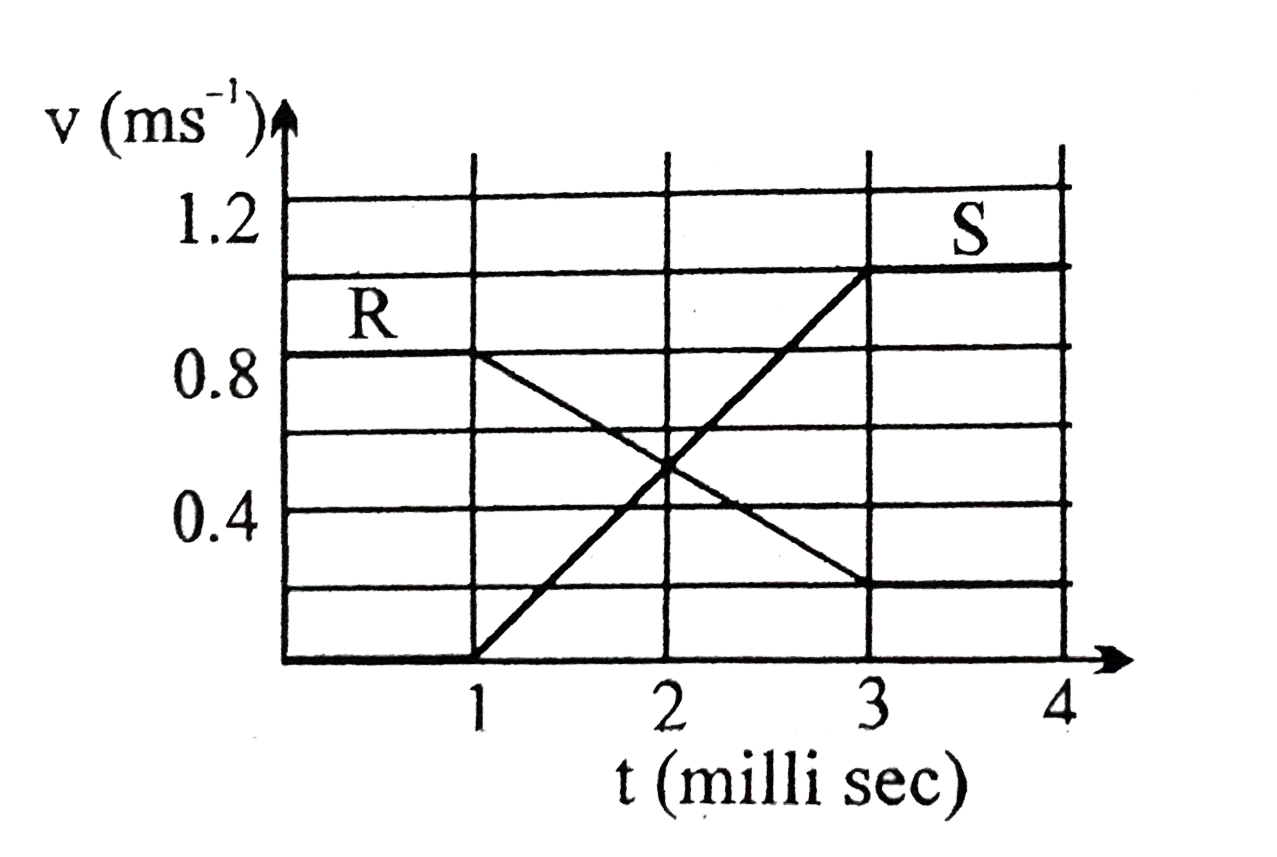
- The diagram shows the velocity-time graph for two masses R an S that c...
Text Solution
|
- PV versus T graph of equal masses ofH(2), He and CO(2) is shown in fig...
Text Solution
|
- Two discs A and B of radii 'R' and '2R' respectively are placed on a h...
Text Solution
|
- Two rods of different materials having coefficient of thermal expansio...
Text Solution
|
- Two light wires of the same material (Young's modulus Y) and same leng...
Text Solution
|