Home
Class 11
CHEMISTRY
Which of the following plots are correct...

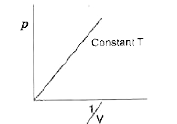
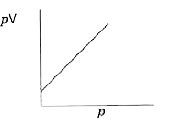
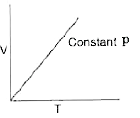
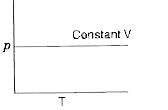
Which of the following plots are correct for an ideal gas ?

A

B

C

D

Text Solution

AI Generated Solution

The correct Answer is:
To determine which plots are correct for an ideal gas, we will analyze each graph based on the fundamental gas laws: Boyle's Law, Charles's Law, and Gay-Lussac's Law. ### Step-by-Step Solution: 1. **Understanding Boyle's Law**: - Boyle's Law states that at constant temperature, the pressure (P) of a gas is inversely proportional to its volume (V). - Mathematically, this can be expressed as: \( P \propto \frac{1}{V} \) or \( PV = k \) (where k is a constant). 2. **Analyzing the First Graph (P vs. 1/V)**: - The first graph plots pressure (P) against the reciprocal of volume (1/V). - According to Boyle's Law, if \( P \propto \frac{1}{V} \), then this relationship will yield a straight line when plotted as P vs. 1/V. - **Conclusion**: This graph is correct. 3. **Analyzing the Second Graph (PV vs. P)**: - The second graph plots the product of pressure and volume (PV) against pressure (P) at constant temperature. - According to Boyle's Law, \( PV = k \) is a constant, which means that if we plot PV against P, it should yield a horizontal line (constant value) parallel to the pressure axis. - **Conclusion**: This graph is incorrect as it does not represent a constant value. 4. **Analyzing the Third Graph (V vs. T)**: - The third graph plots volume (V) against temperature (T) at constant pressure. - According to Charles's Law, volume is directly proportional to temperature: \( V \propto T \). - This relationship yields a straight line with a constant slope when plotted. - **Conclusion**: This graph is correct. 5. **Analyzing the Fourth Graph (P vs. T)**: - The fourth graph plots pressure (P) against temperature (T) at constant volume. - According to Gay-Lussac's Law, pressure is directly proportional to temperature: \( P \propto T \). - This relationship also yields a straight line with a constant slope when plotted. - However, if the graph shown is parallel to the temperature axis, it suggests that pressure does not change with temperature, which is incorrect. - **Conclusion**: This graph is incorrect. ### Final Answer: The correct plots for an ideal gas are **Option A (P vs. 1/V)** and **Option C (V vs. T)**.
Promotional Banner

Topper's Solved these Questions

  • STATES OF MATTER : GASES AND LIQUIDS

    MODERN PUBLICATION|Exercise COMPETITION FILE OBJECTIVE TYPE QUESTIONS (D. MULTIPLE CHOICE QUESTIONS)|7 Videos
  • STATES OF MATTER : GASES AND LIQUIDS

    MODERN PUBLICATION|Exercise COMPETITION FILE OBJECTIVE TYPE QUESTIONS (D. MULTIPLE CHOICE QUESTIONS)(Matrix Match Type Question)|2 Videos
  • STATES OF MATTER : GASES AND LIQUIDS

    MODERN PUBLICATION|Exercise COMPETITION FILE OBJECTIVE TYPE QUESTIONS (B. MULTIPLE CHOICE QUESTIONS)(JEE (ADVANCED) FOR IIT ENTRANCE)|8 Videos
  • SOME BASIC CONCEPTS OF CHEMISTRY

    MODERN PUBLICATION|Exercise COMPETITION FILE (INTEGER TYPE AND NUMERICAL VALUE TYPE QUESTIONS)|10 Videos
  • STRUCTURE OF ATOM

    MODERN PUBLICATION|Exercise Unit Practice Test|13 Videos

Similar Questions

Explore conceptually related problems

Which of the following plots is/are correct?

Which of the following plots is/are correct?

Which of the following curve is correct for an ideal gas ?

Which of the following expressions are correct for an ideal gas ?

Which of the following relation is correct for an ideal gas ?

Which of the following is not correct for an ideal gas as per first low of thermodynamics

Which of the following graph is incorrect for an ideal gas?