Home
Class 11
PHYSICS
A tall cylinder is filled with viscous o...

A tall cylinder is filled with viscous oil. A round pebble is dropped from the top with zero initial velocity. From the plot shown in figure, indicate the one that represents the velocity `(v)` of the pebble as a function of time `(t)`

A

B

C

D

Text Solution

AI Generated Solution

The correct Answer is:
To solve the problem of determining the velocity of a pebble dropped into viscous oil as a function of time, we can analyze the forces acting on the pebble and how they affect its motion. Here’s a step-by-step breakdown: ### Step 1: Understand the Forces Acting on the Pebble When the pebble is dropped into the viscous oil, two main forces act on it: - The gravitational force (downward): \( F_g = mg \) - The viscous drag force (upward): \( F_d = 6 \pi \eta r v \) Where: - \( m \) is the mass of the pebble, - \( g \) is the acceleration due to gravity, - \( \eta \) is the viscosity of the oil, - \( r \) is the radius of the pebble, - \( v \) is the velocity of the pebble. ### Step 2: Analyze the Motion of the Pebble Initially, when the pebble is dropped, its velocity \( v = 0 \). At this moment, the viscous drag force is also zero, and the only force acting on the pebble is the gravitational force. This means the pebble will start accelerating downwards. ### Step 3: Determine the Acceleration As the pebble accelerates, the viscous drag force begins to increase with the velocity. The net force acting on the pebble can be expressed as: \[ F_{net} = mg - F_d \] Using Newton's second law, we can write: \[ ma = mg - 6 \pi \eta r v \] Where \( a \) is the acceleration of the pebble. ### Step 4: Terminal Velocity As time progresses, the velocity of the pebble increases, which in turn increases the viscous drag force. Eventually, the viscous drag force will equal the gravitational force, and the net force will become zero. This condition is known as terminal velocity \( v_t \), where: \[ mg = 6 \pi \eta r v_t \] At this point, the pebble will stop accelerating and continue to fall at a constant velocity (terminal velocity). ### 
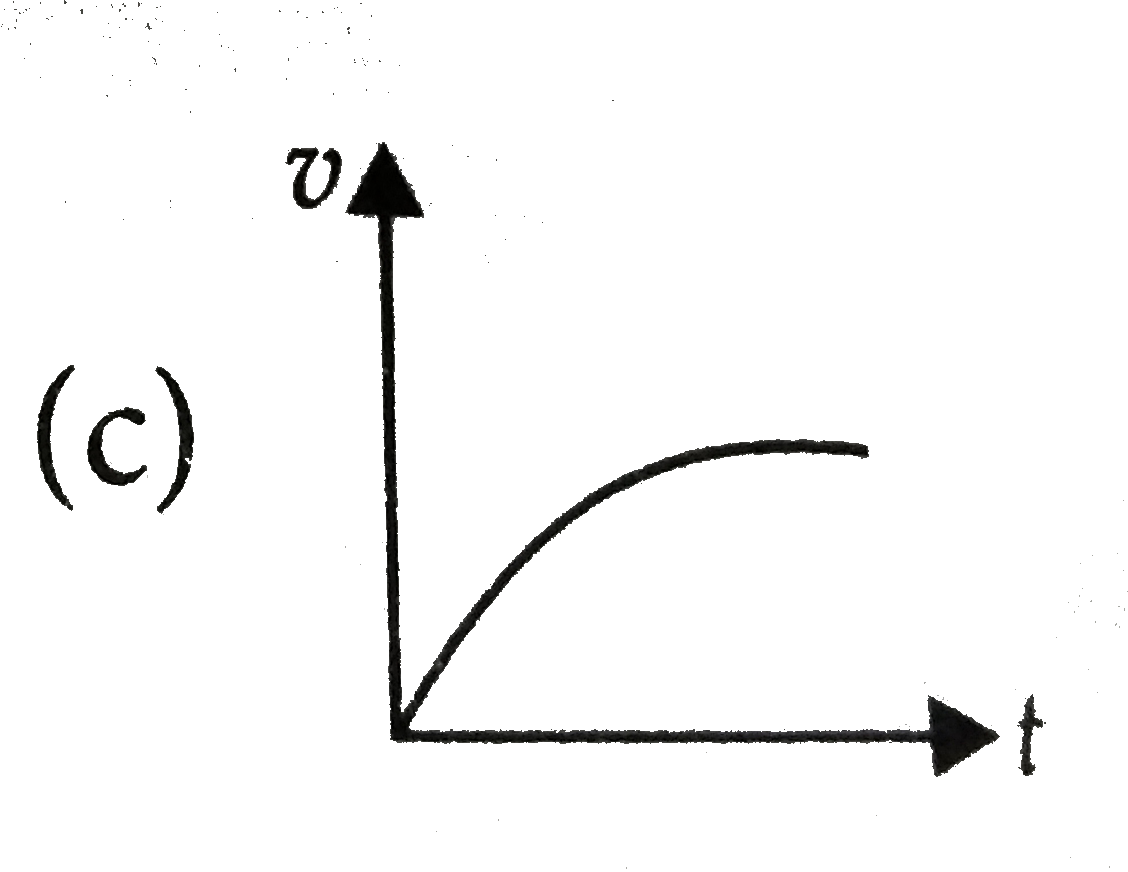
Step 5: Sketch the Velocity vs. Time Graph From the analysis: - Initially, the velocity increases rapidly as the pebble accelerates. - As the pebble approaches terminal velocity, the rate of increase of velocity decreases. - Finally, the velocity levels off as the pebble reaches terminal velocity. Therefore, the graph of velocity \( v \) as a function of time \( t \) will start at zero, rise quickly, and then gradually level off as it approaches terminal velocity. ### Conclusion Based on this analysis, the correct graph that represents the velocity of the pebble as a function of time is the one that shows an initial steep increase followed by a gradual leveling off, indicating the approach to terminal velocity.

To solve the problem of determining the velocity of a pebble dropped into viscous oil as a function of time, we can analyze the forces acting on the pebble and how they affect its motion. Here’s a step-by-step breakdown: ### Step 1: Understand the Forces Acting on the Pebble When the pebble is dropped into the viscous oil, two main forces act on it: - The gravitational force (downward): \( F_g = mg \) - The viscous drag force (upward): \( F_d = 6 \pi \eta r v \) Where: ...
Doubtnut Promotions Banner Mobile Dark
|

Topper's Solved these Questions

  • MECHANICAL PROPERTIES OF FLUIDS

    NCERT FINGERTIPS ENGLISH|Exercise Assertion and reason|15 Videos
  • MECHANICAL PROPERTIES OF FLUIDS

    NCERT FINGERTIPS ENGLISH|Exercise Pressure|28 Videos
  • MECHANICAL PROPERTIES OF FLUIDS

    NCERT FINGERTIPS ENGLISH|Exercise Higher Order Thinking Skills|8 Videos
  • LAWS OF MOTION

    NCERT FINGERTIPS ENGLISH|Exercise Assertion And Reason|15 Videos
  • MECHANICAL PROPERTIES OF SOLIDS

    NCERT FINGERTIPS ENGLISH|Exercise Assertion And Reason|15 Videos

Similar Questions

Explore conceptually related problems

The figure shows the velocity (v) of a particle plotted against time (t).

The figure shows the velocity (v) of a particle plotted against time (t).

A ball is projected horizontally from an inclined plane with a velocity V, as shown in the figure. It will strike the plane after a time

A ball is thrown vertically upwards from the top of tower of height h with velocity v . The ball strikes the ground after time.

A trolley filled with sand is moving with a velocity v on a smooth horizontal surface due to inertia. If the sand falls off at the rate of mu kg//sec , the velocity of the trolley as a function of time will be best represented by:

From the velocity time plot shown in figure find the distance travelled by the particle dureing the first 40 seconds. Also find the average velocity during this period.

A rocket is launched upward from the earth surface whose velocity time graph shown in figure. Then maximum height attained by the rocket is :

The graph shown the variation with times t of the velocity v of an object . Which one of the following graphs best represents the variation of acceleration a of the object with time t ?

A pobble is thrown vertically upwards from a bridge with an initial velocity of 4.9 ms^(-1) . It strikes the water after 2 s. If acceleration due to gravity does the pebble strike the water ?

A car changes its velocity linearly from 10 m//s to 20 m//s in 5 seconds. Plot v-t graph and write velocity as a function of time.