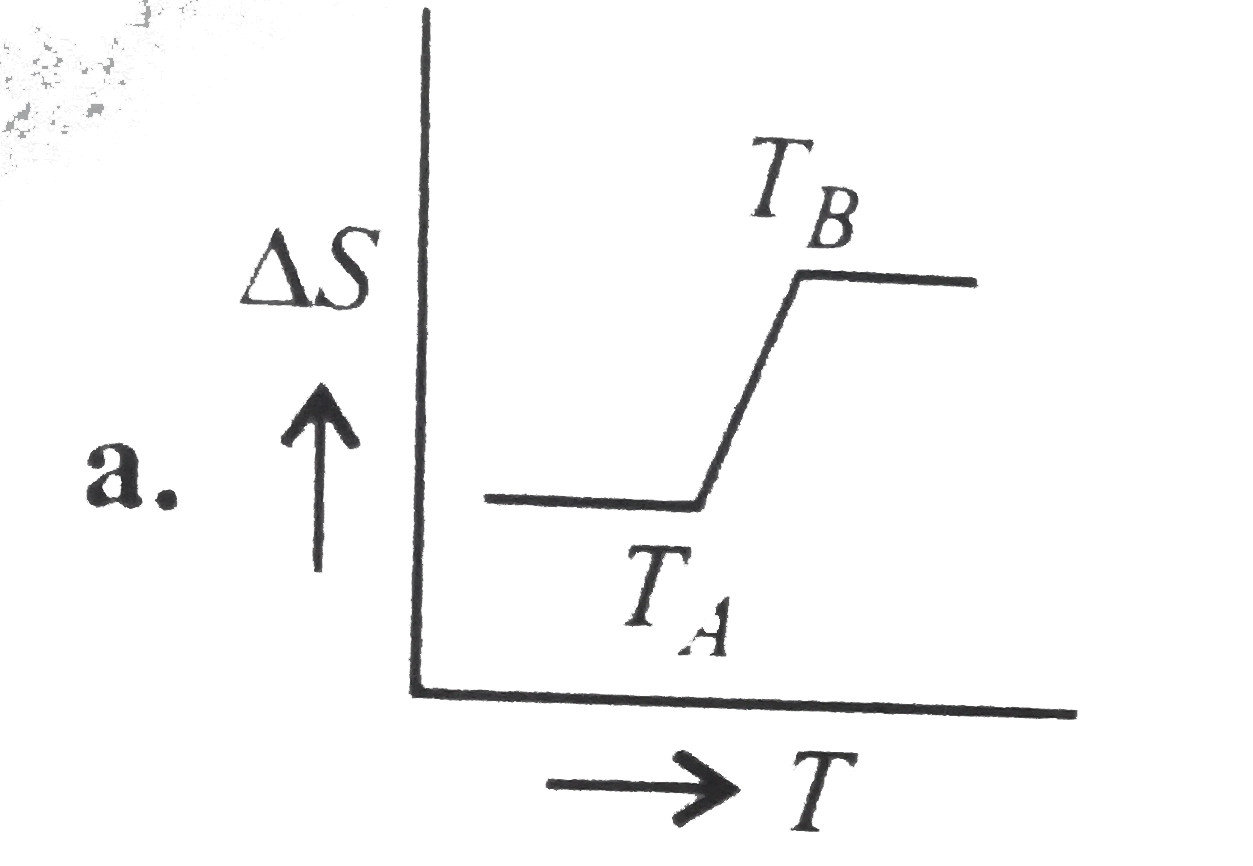
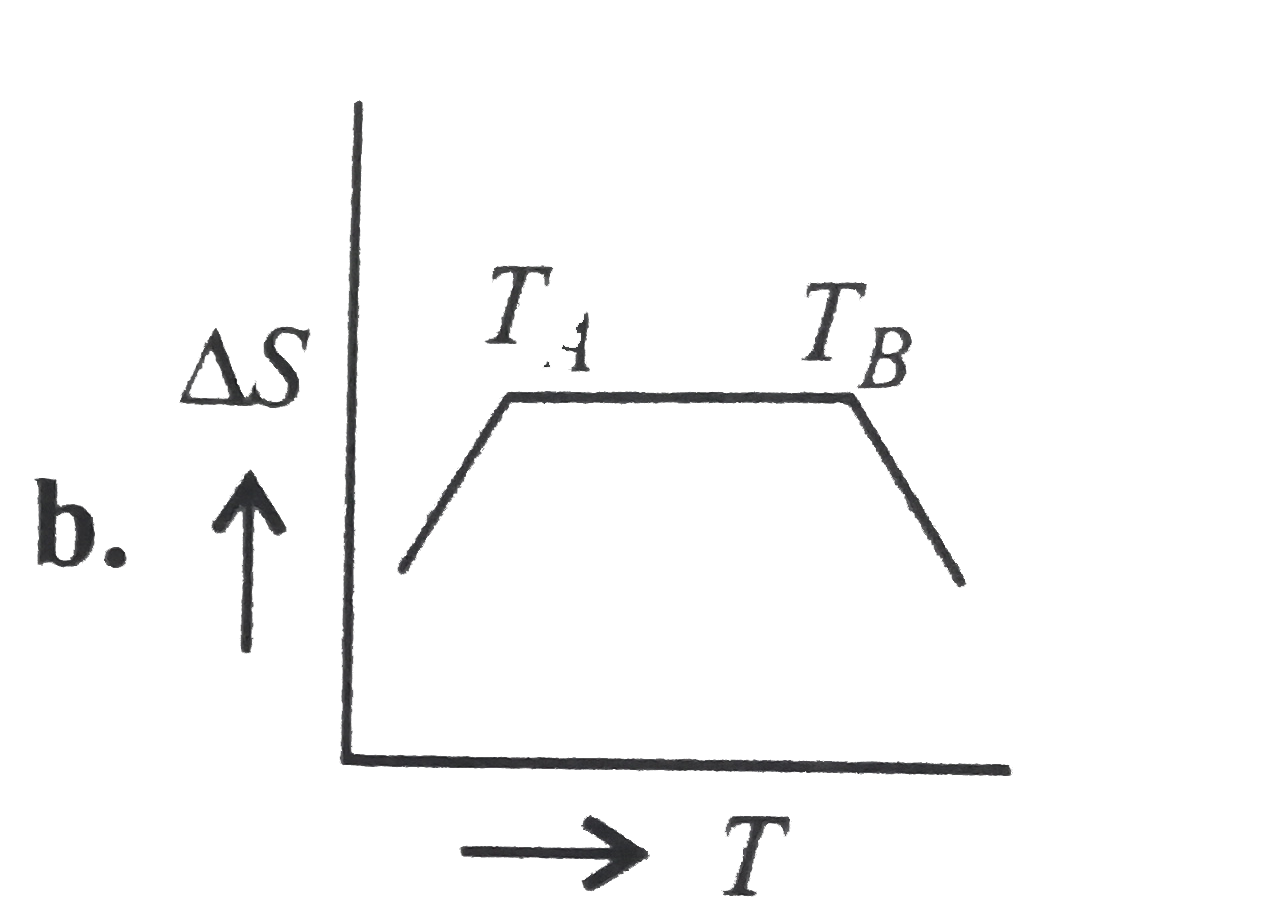
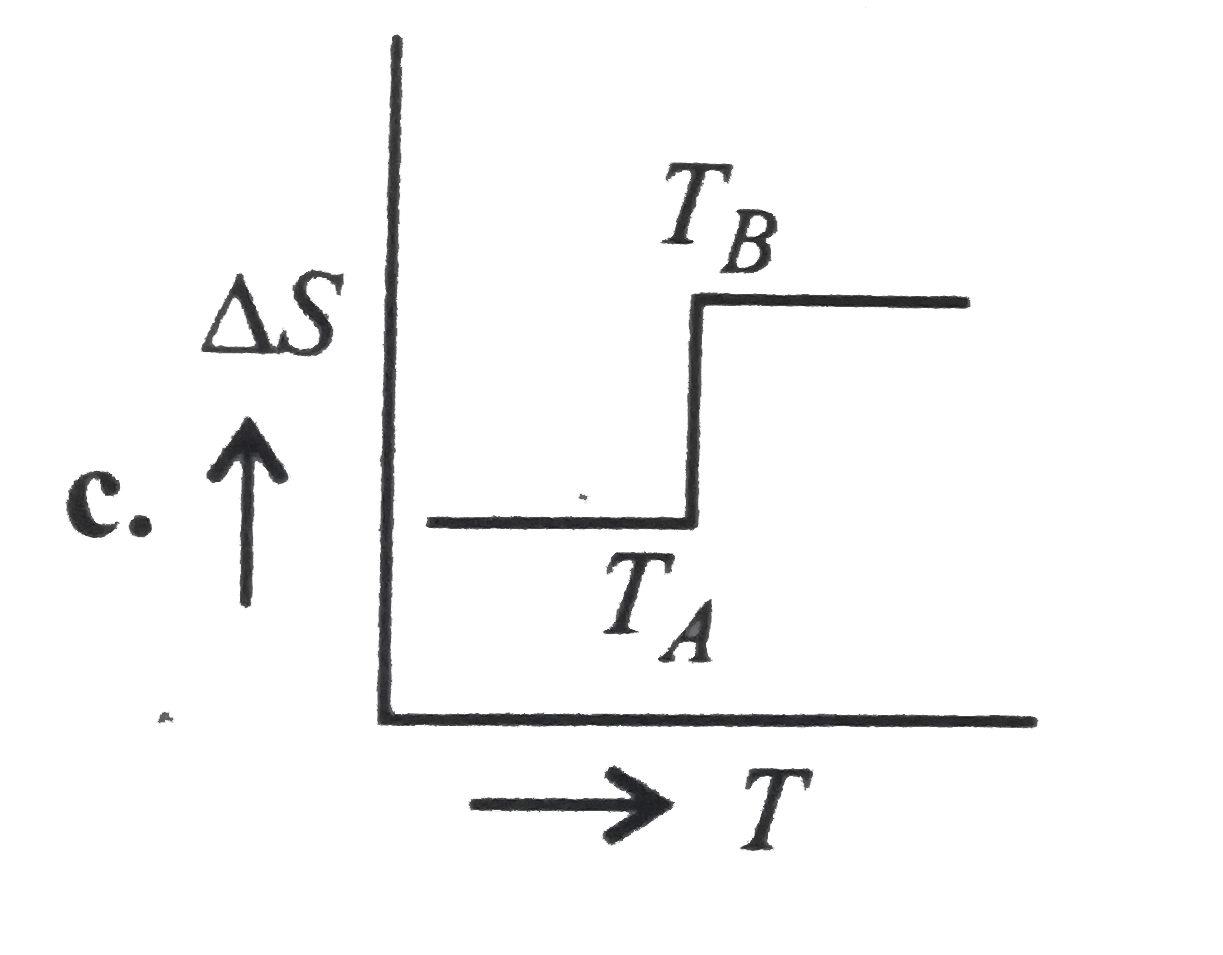
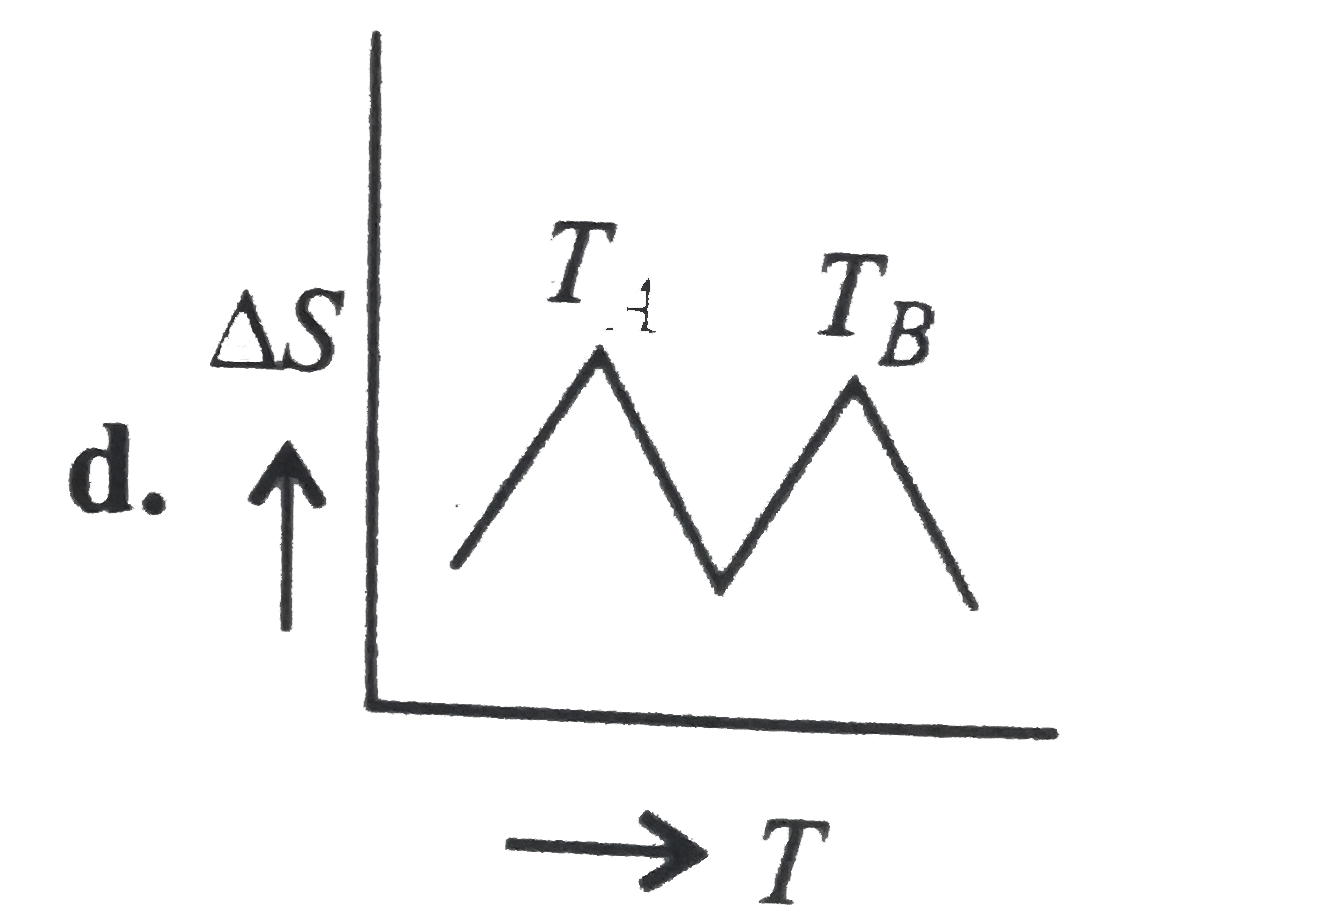
If, for a given substance, `T_(B)` is the melting point and `T_(A)` is the freezing point, then the correct variation of entropy by the graph between entropy change `(DeltaS)` and temperature is:
A
B
C
D
Text Solution
AI Generated Solution
Topper's Solved these Questions
THERMODYNAMICS
CENGAGE CHEMISTRY ENGLISH|Exercise Ex 6.1|26 Videos
THERMODYNAMICS
CENGAGE CHEMISTRY ENGLISH|Exercise Ex 6.2|27 Videos
The graph between the (velocity^(2)) and temperature T of a gas is
The relationship between the free energy change (DeltaG) and entropy change (DeltaS) at constant temperature (T) si
The correct graph which shows the variation of paramagnetic susceptibility S with temperature T is
Correct order of melting point of the given compounds is
At a certain temperature T, the endothermic reaction A rarr B proceeds almost to completion.The entropy change is :
Choose the correct graph of variation of magnetic susceptibility X_m of paramagnetic substance versus absolute temperature T.
The enthalpy change for a given reaction at 298 K is -x cal mol^(-1) . If the reaction occurs spontaneously at 298 K , the entropy change at that temperature
The change in entropy, Delta S is positive for an endothermic reaction, if enthalpy change Delta H occurs at the same temperature T, then the reaction is feasible
Look at the change of state diagram from gas to solid given here carefully, and answer the following questions. a. During freezing, certain amount of heat is given out without any change in temperature. Which part of the graph shows this change? b. During condensation, certain amount of heat is given out without any change in temperature. Which part of the graph shows this change? c. Which point on the graph corresponds to İ. condensation point? ii. freezing point? d. What do ab and cd on the graph represent?
How does entropy changes with a. Increase in temperature b. Decrease in pressure?