Home
Class 12
PHYSICS
The figure shows an energy level diagram...

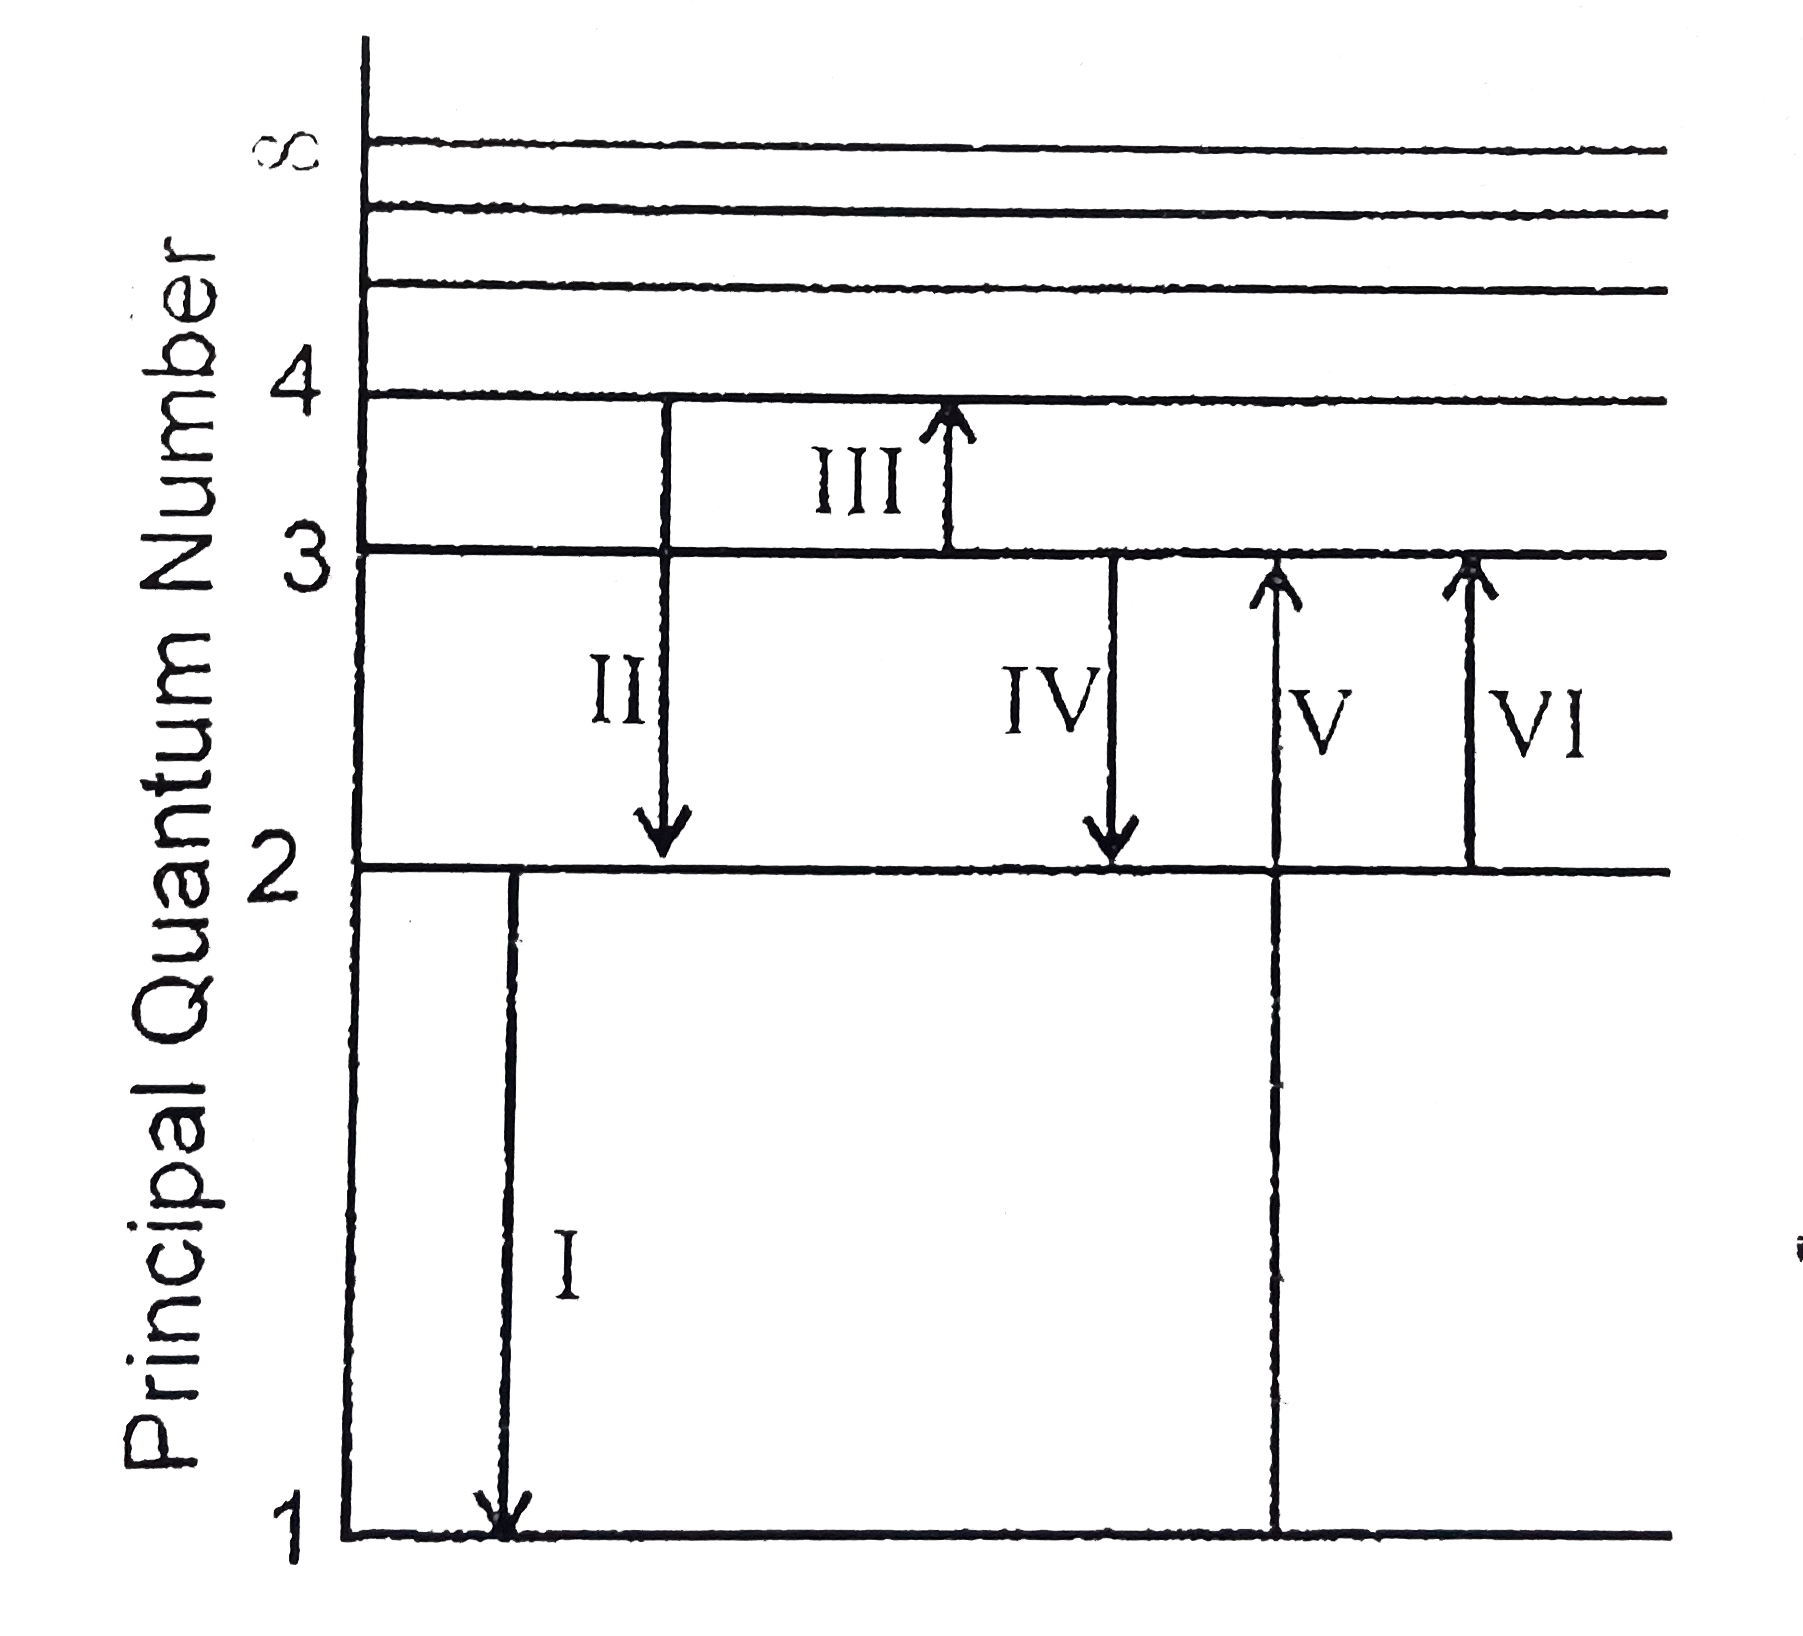
The figure shows an energy level diagram for the hydrogen atom. Several transitions are marked as I, II, III,_____. The diagram is only indicative and not be scale.

Which transition will occur when a hydrogen atom is irradiated with radiation of wavelength `103 nm`.

A

II

B

II

C

IV

D

V

Text Solution

Verified by Experts

The correct Answer is:
D

Wavelength of radiation `=103 nm=1030 Å`
`:. DeltaE=(12400)/(1030 Å) cong 12.0 eV`
So difference of energy should be `12.0 eV` (approx)
Hence `n_(1)=1` and `n_(2)=3`
`(-13.6) eV" "(-1.51)eV`
`:.` Transition is V.
Doubtnut Promotions Banner Mobile Dark
|

Topper's Solved these Questions

  • SIMPLE HARMONIC MOTION

    ALLEN |Exercise Exercise - 27|2 Videos
  • SIMPLE HARMONIC MOTION

    ALLEN |Exercise Exercise - 28|2 Videos
  • SIMPLE HARMONIC MOTION

    ALLEN |Exercise Exercise - 25|2 Videos
  • RACE

    ALLEN |Exercise Basic Maths (Wave Motion & Dopplers Effect) (Stationary waves & doppler effect, beats)|25 Videos
  • TEST PAPER

    ALLEN |Exercise PHYSICS|4 Videos

Similar Questions

Explore conceptually related problems
The figure shows an energy level diagram for the hydrogen atom. Several transitions are marked as I, II, III,_____. The diagram is only indicative and not be scale. In which transitions is a Balmer photn absorbed?

The figure shows an energy level diagram for the hydrogen atom. Several transitions are marked as I, II, III,_____. The diagram is only indicative and not be scale. In which transitions is a Balmer photn absorbed?

Knowledge Check

  • The diagram shows the energy levels for an electron in a certain atom. Which transition shown represent the emission of a photon with the most energy ?

    A
    I
    B
    II
    C
    III
    D
    IV
  • The diagram shows the energy levels for an electron in a certain atom. Which transition shown represent the emission of a photon with the most energy?

    A
    I
    B
    II
    C
    III
    D
    IV
  • The ionization energy of the electron in the hydrogen atom in its ground state is 13.6 eV. The atoms are excited to higher energy levels to emit radiation of 6 wavelengths. During which of the following transitions will the maximum wavelength radiation be emitted ?

    A
    n=3 to n=1
    B
    n=2 to n=1
    C
    n = 4 to n=3
    D
    n=3 to n = 2
  • Similar Questions

    Explore conceptually related problems

    The figure shows an energy level diagram for the hydrogen atom. Several transitions are marked as I, II, III ",______," the diagram is only indicative and not to scale. . Which transition involves the longest wavelength line in the visible portion of the hydrogen spectrum

    Explain by drawing a line spectra diagram of the transition between energy levels in an atom.

    The figure indicates the enegry level diagram of an atom and the origin of six spectral lines in emission (e.g. line no. 5 series from the transition from level B to A ). The following spectral lines will also occur in the absorption spectrum

    Each phase of a material can exits only in certain regions of pressure and temperature . P-T phase diagrams, in which pressure is plotted versus temperature, show the regions corresponding to various phases and phase transformations . P-V diagrams, on the other hand , can be used to study pressure volume relationship at a constant temperature. If the liquid and gaseous phases of a pure substances are heated together in a closed container, both the temperature and the vapor pressure will increase until a point is reached at which the two phases can no longer be distinguished from one another. The temperature and pressure at which this occurs are called the critical temperature and pressure. Exceeding either of these parameters, by itself ,will cause the "gas"//"liguid" phase transition to disappear. if the other variable is then changed as well, while the first variable is maintained above its critical point , a gradual transition will occur between the gaseous and liquid phases, with no clear boundary.(The liquid and solid phases, on the other hand , maintain a distinct boundary at all pressure above the triple point). Shown in figure is a combined P-T phase diagram for material A and B . Which is true about the substance in figure?

    Each phase of a material can exits only in certain regions of pressure and temperature . P-T phase diagrams, in which pressure is plotted versus temperature, show the regions corresponding to various phases and phase transformations . P-V diagrams, on the other hand , can be used to study pressure volume relationship at a constant temperature. If the liquid and gaseous phases of a pure substances are heated together in a closed container, both the temperature and the vapor pressure will increase until a point is reached at which the two phases can no longer be distinguished from one another. The temperature and pressure at which this occurs are called the critical temperature and pressure. Exceeding either of these parameters, by itself ,will cause the "gas"//"liguid" phase transition to disappear. if the other variable is then changed as well, while the first variable is maintained above its critical point , a gradual transition will occur between the gaseous and liquid phases, with no clear boundary.(The liquid and solid phases, on the other hand , maintain a distinct boundary at all pressure above the triple point). Shown in figure is a combined P-T phase diagram for material A and B . If heat is added to solids A and B , each in a container that is open to the atmosphere :-