A
B
C
D
Text Solution
Verified by Experts


Topper's Solved these Questions
MOTION
BEIITIANS|Exercise IIT JEE WORKSHEET (SINGLE CORRECT ANSWER TYPE-I)|8 VideosMOTION
BEIITIANS|Exercise IIT JEE WORKSHEET (MULTIPLE CORRECT ANSWER TYPE-II)|5 VideosMOTION
BEIITIANS|Exercise SUMMATIVE WORKSHEET|2 VideosMEASUREMENT
BEIITIANS|Exercise IIT JEE WORKSHEET (IV INTEGER TYPE)|1 VideosSOUND
BEIITIANS|Exercise IIT JEE Worksheet (V. Matrix Matching)|5 Videos
Similar Questions
Explore conceptually related problems
BEIITIANS-MOTION-HOTS WORKSHEET
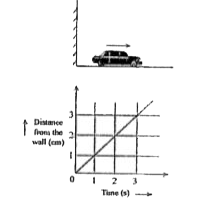
- A toy car is moving away from a wall, as shown in the given figure. As...
Text Solution
|
- Julian is recording the time take by an ant to travel on the edges of ...
Text Solution
|
- The reading of the odometer of a bus, which is about to start its jour...
Text Solution
|
- The odometer of a scooter reads 14316.0 km. The person is moving with ...
Text Solution
|
- In a race, Zaheer and Abbas run with a speed such that the former take...
Text Solution
|
- A cyclist is travelling with a uniform speed on a straight road. After...
Text Solution
|
- Raj can run twice as fast as Lokesh. Raj runs for 10 min to cover the ...
Text Solution
|
- A car moves from point M to point N with uniform speed in 3 min. There...
Text Solution
|
- Consider the following statements: Car I is parked near a post office ...
Text Solution
|
- An airplane starts its journey from Delhi to Chennai at 8:50 am. When ...
Text Solution
|
- A car is moving with a speed of 53 km/h. it can cover a distance of 31...
Text Solution
|