A
B
C
D
Text Solution
Verified by Experts


Topper's Solved these Questions
MOTION
BEIITIANS|Exercise IIT JEE WORKSHEET (MULTIPLE CORRECT ANSWER TYPE-II)|5 VideosMOTION
BEIITIANS|Exercise IIT JEE WORKSHEET (PARAGRAPH TYPE III)|3 VideosMOTION
BEIITIANS|Exercise HOTS WORKSHEET |11 VideosMEASUREMENT
BEIITIANS|Exercise IIT JEE WORKSHEET (IV INTEGER TYPE)|1 VideosSOUND
BEIITIANS|Exercise IIT JEE Worksheet (V. Matrix Matching)|5 Videos
Similar Questions
Explore conceptually related problems
BEIITIANS-MOTION-IIT JEE WORKSHEET (SINGLE CORRECT ANSWER TYPE-I)
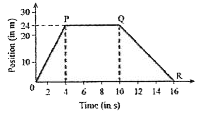
- The position versus time graph of the motion of a boy along a straight...
Text Solution
|
- While sitting in the car Zaheer observes that there is no change in th...
Text Solution
|
- There is some problem in the speedometer of Raju's car. It always indi...
Text Solution
|
- Ajay and Rahul, are participating in a 100 m race. Ajay runs with a sp...
Text Solution
|
- A boy ran for 30 minutes and then walked for the same time to cover a ...
Text Solution
|
- Rohit saw that its odometer reading was 1020 km. Before getting off th...
Text Solution
|
- At the start of the journey, Ram saw that the odometer reading is 1500...
Text Solution
|
- Ram can run twice as fast as Shyam. Shyam runs for 5 minutes and Ram r...
Text Solution
|