Text Solution
Verified by Experts
The correct Answer is:


Topper's Solved these Questions
KINEMATICS
ALLEN|Exercise Exercise-04[B]|14 VideosKINEMATICS
ALLEN|Exercise Exercise-05 [A]|11 VideosKINEMATICS
ALLEN|Exercise Comprehension#7|3 VideosERROR AND MEASUREMENT
ALLEN|Exercise Part-2(Exercise-2)(B)|22 VideosKINEMATICS (MOTION ALONG A STRAIGHT LINE AND MOTION IN A PLANE)
ALLEN|Exercise BEGINNER S BOX-7|8 Videos
Similar Questions
Explore conceptually related problems
ALLEN-KINEMATICS-EXERCISE-04[A]
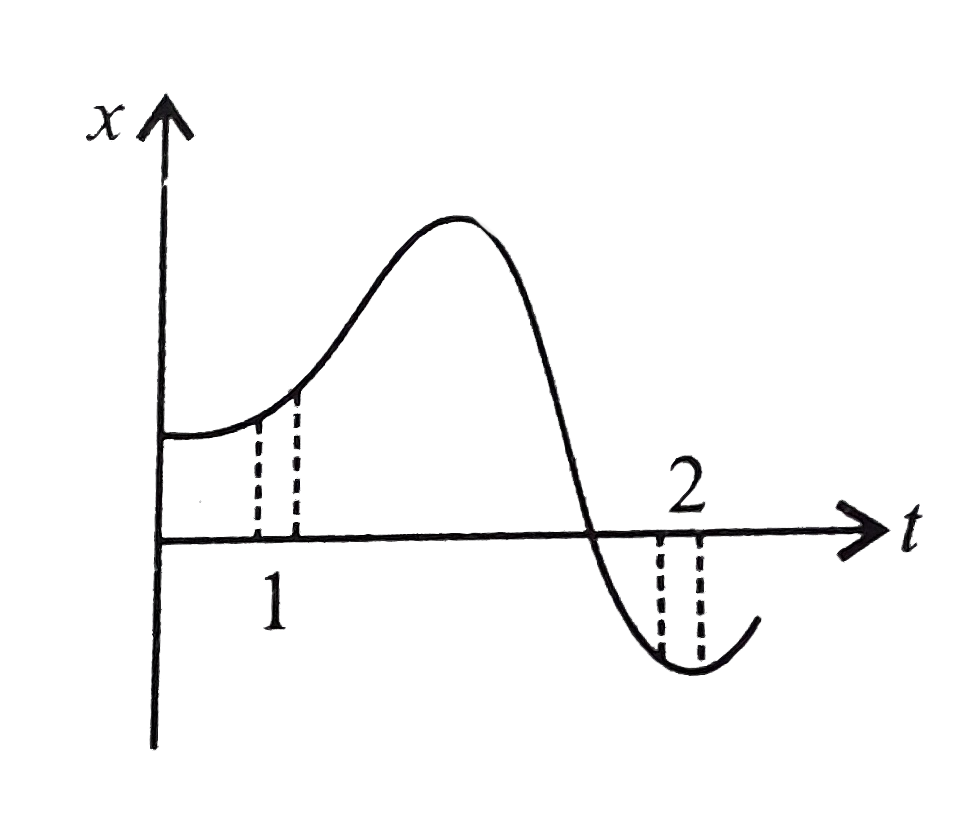
- Figure shows the x-t plot of a particle in one-dimensional motion. Two...
Text Solution
|
- The position-time (x-t) graphs for two children A and B returning from...
Text Solution
|
- A particle is moving along x-axis with accelerationa = a(0) (1 – t//T)...
Text Solution
|
- A particle travels a distance of 20 m in the 7^(th) seconds and 24 m i...
Text Solution
|
- A lift accelerates downwards from rest at rate of 2 m//s^(2), starting...
Text Solution
|
- A parachutist after bailing out falls 52 m without friction. When the ...
Text Solution
|
- A train, travelling at 20 kmh^(-1) is approaching a platform. A bird i...
Text Solution
|
- A driver travelling at speed 36 kmh^(-1) sees the light trun red at th...
Text Solution
|
- A ball is thrown vertically upwards with a velocity of 20 m s^(-1) fro...
Text Solution
|
- A balloon is going upwards with a constant velocity 15 m//s. When the ...
Text Solution
|
- A train moves from one station to another in two hours time. Its speed...
Text Solution
|
- A particle starts motion from rest and moves along a straight line. It...
Text Solution
|
- Two cars are travelling towards each other on a straight road with vel...
Text Solution
|
- Two trains A and B 100 m and 60 m long are moving in opposite directio...
Text Solution
|
- In a harbour, wind is blowing at the speed of 72km//h and the flag on ...
Text Solution
|
- Two motor cars start from A simultaneouslu and reach B after 2 h. The ...
Text Solution
|
- n' number of particles are located at the verticles of a regular polyg...
Text Solution
|
- A man wishes to cross a river in a boat. If he crosses the river in mi...
Text Solution
|
- A particle is projected with a speed v and an angle theta to the horiz...
Text Solution
|
- A projectile is thrown with speed u making angle theta with horizontal...
Text Solution
|