A
B
C
D
Text Solution
Verified by Experts
The correct Answer is:


Topper's Solved these Questions
STATISTICS AND DATA INTERPRETATION
KIRAN PUBLICATION|Exercise TYPE-IV|182 VideosSTATISTICS AND DATA INTERPRETATION
KIRAN PUBLICATION|Exercise TYPE-V|38 VideosSTATISTICS AND DATA INTERPRETATION
KIRAN PUBLICATION|Exercise TYPE-II|131 VideosSIMPLIFICATION
KIRAN PUBLICATION|Exercise TEST YOURSELF|25 VideosTIME AND DISTANCE
KIRAN PUBLICATION|Exercise Type -XI|74 Videos
Similar Questions
Explore conceptually related problems
KIRAN PUBLICATION-STATISTICS AND DATA INTERPRETATION-TYPE-III
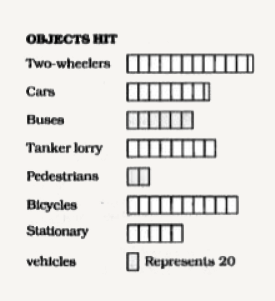
- The following is a horizontal bar diagram showing the accidents in whi...
Text Solution
|
- The following is a horizontal bar diagram showing the accidents in whi...
Text Solution
|
- The following is a horizontal bar diagram showing the accidents in whi...
Text Solution
|
- The following is a horizontal bar diagram showing the accidents in whi...
Text Solution
|
- The following is a horizontal bar diagram showing the accidents in whi...
Text Solution
|
- The bar graph given here shows the number of jobseekers of a state in ...
Text Solution
|
- The bar graph given here shows the number of jobseekers of a state in ...
Text Solution
|
- The bar graph given here shows the number of jobseekers of a state in ...
Text Solution
|
- The bar graph given here shows the number of jobseekers of a state in ...
Text Solution
|
- The bar chart given below shows the percentage distribution of the pro...
Text Solution
|
- The bar chart given below shows the percentage distribution of the pro...
Text Solution
|
- The bar chart given below shows the percentage distribution of the pro...
Text Solution
|
- The bar chart given below shows the percentage distribution of the pro...
Text Solution
|
- The bar chart given below shows the percentage distribution of the pro...
Text Solution
|
- The sub divided bar diagram given below depicts H.S. Students of a sch...
Text Solution
|
- Direction : The sub divided bar diagram given below depicts H.S Studen...
Text Solution
|
- The sub divided bar diagram given below depicts H.S. Students of a sch...
Text Solution
|
- Direction : The sub divided bar diagram given below depicts H.S Studen...
Text Solution
|
- The sub divided bar diagram given below depicts H.S. Students of a sch...
Text Solution
|
- Study the diagram and answer the questions. If the total annual e...
Text Solution
|