Home
Class 11
CHEMISTRY
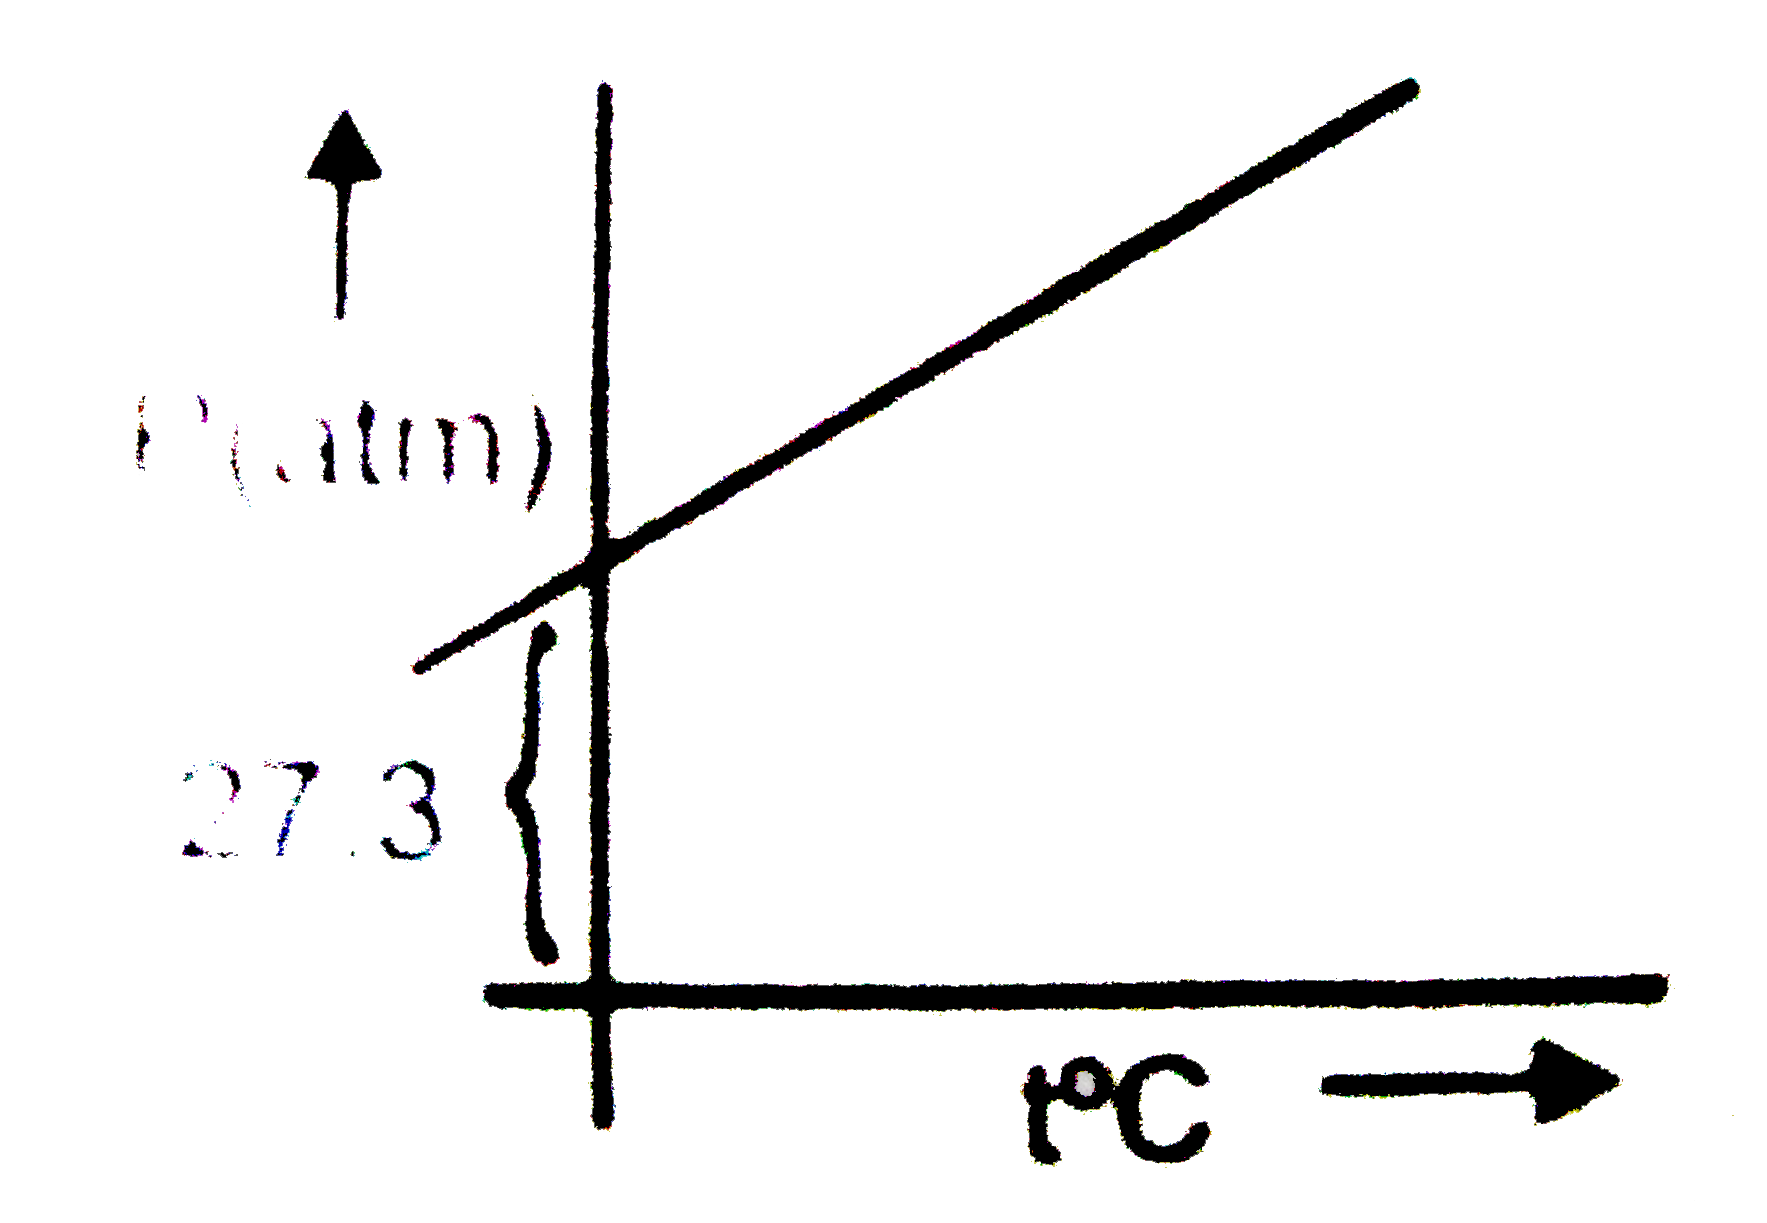
A graph is plotted between p (atm) vs t^...

A graph is plotted between p (atm) vs `t^(@)C` for 10 mol of an ideal gas as follows:
Then slope of curve and volume of container (L) respectively, are:

A

0.1,8.21

B

8.21,0.1

C

27.3,8.21

D

8.21,27.3

Text Solution

Verified by Experts

The correct Answer is:
a
Doubtnut Promotions Banner Mobile Dark
|

Topper's Solved these Questions

  • GASEOUS STATE

    NARENDRA AWASTHI|Exercise Level 3 - Passage|1 Videos
  • GASEOUS STATE

    NARENDRA AWASTHI|Exercise Level 3 - Subjective Problems|1 Videos
  • GASEOUS STATE

    NARENDRA AWASTHI|Exercise Level 1 (Q.151 To Q.176)|1 Videos
  • ELECTROCHEMISTRY

    NARENDRA AWASTHI|Exercise Level 3 - Subjective Problems|1 Videos
  • IONIC EEQUILIBRIUM

    NARENDRA AWASTHI|Exercise Assertin-Reason Type Questions|1 Videos

Similar Questions

Explore conceptually related problems
Draw the P-T and V-T diagrams for an isothermal process, corresponding to one mole of an ideal gas at an initial pressure and volume P_(0) and V_(0) respectively, expanding to a volume 2V_(0) .

Draw the P-T and V-T diagrams for an isothermal process, corresponding to one mole of an ideal gas at an initial pressure and volume P_(0) and V_(0) respectively, expanding to a volume 2V_(0) .

Knowledge Check

  • The P-T graph for the given mass of an ideal gas is shown in figure. Then the volume

    A
    increases
    B
    decreases
    C
    remains constant
    D
    data insufficient
  • Two different at constant. The relationship between volume V and the pressure P at a given temperature of same ideal gas are shown for masses m_1 and m_2 of the gas respectively. Then

    A
    `m_1 gt m_2`
    B
    `m_1 = m_2`
    C
    `m_1 lt m_2`
    D
    `m_1 = 2m_2`
  • A graph is ploted between log V and log T for two moles of gas at constant pressure of 0.0821 atm. [V and T are in litres and kelvin]. Then which of the following is/are correct

    A
    The graph is a straight line with slope +1
    B
    The graph is a straight line with slope -1
    C
    The intercept on Y-axis is 0.301
    D
    The intercept on Y-axis is 2
  • Similar Questions

    Explore conceptually related problems

    If the ideal gas given in the problem 45 expands to a final volume of 10L conducted reversibly what is q value?

    For an ideal gas the graph between PV/RT and T is

    A graph is plotted b//w(p)/(d) vs d ("P" is Osmotic pressure of a solution having solute of M.wt "m" and d is density temperature T) Pick out the correct statements about the plots .

    Diagram shows a graph between pressure and density for an ideal gas at two temperatures T_1 and T_2 . Which is correct ?

    Diagram shows a graph between pressure and density for an ideal gas at two temperatures T_1 and T_2 which is correct