A
B
C
D
Text Solution
Verified by Experts
The correct Answer is:


Topper's Solved these Questions
STATES OF MATTER : GASES AND LIQUIDES
PRADEEP|Exercise COMPETITION FOCUS (Miscellaneous)|6 VideosSTATES OF MATTER : GASES AND LIQUIDES
PRADEEP|Exercise II. Multiple Choice Questions|7 VideosSTATES OF MATTER : GASES AND LIQUIDES
PRADEEP|Exercise COMPETITION FOCUS (Liquefaction of gases and critical temperature)|3 VideosSOME p-BLOCK ELEMENTS
PRADEEP|Exercise Competition Focus (JEE( Main and Advanced)/Medical Entrance) VIII. Assertion-Reason Type Questions (Type I)|23 VideosSTATES OF MATTER: SOLID MATTER
PRADEEP|Exercise COMPETITION FOCUS (ASSERTION-REASON)|17 Videos
Similar Questions
Explore conceptually related problems
PRADEEP-STATES OF MATTER : GASES AND LIQUIDES-COMPETITION FOCUS (Liquid state and properties of liquid)
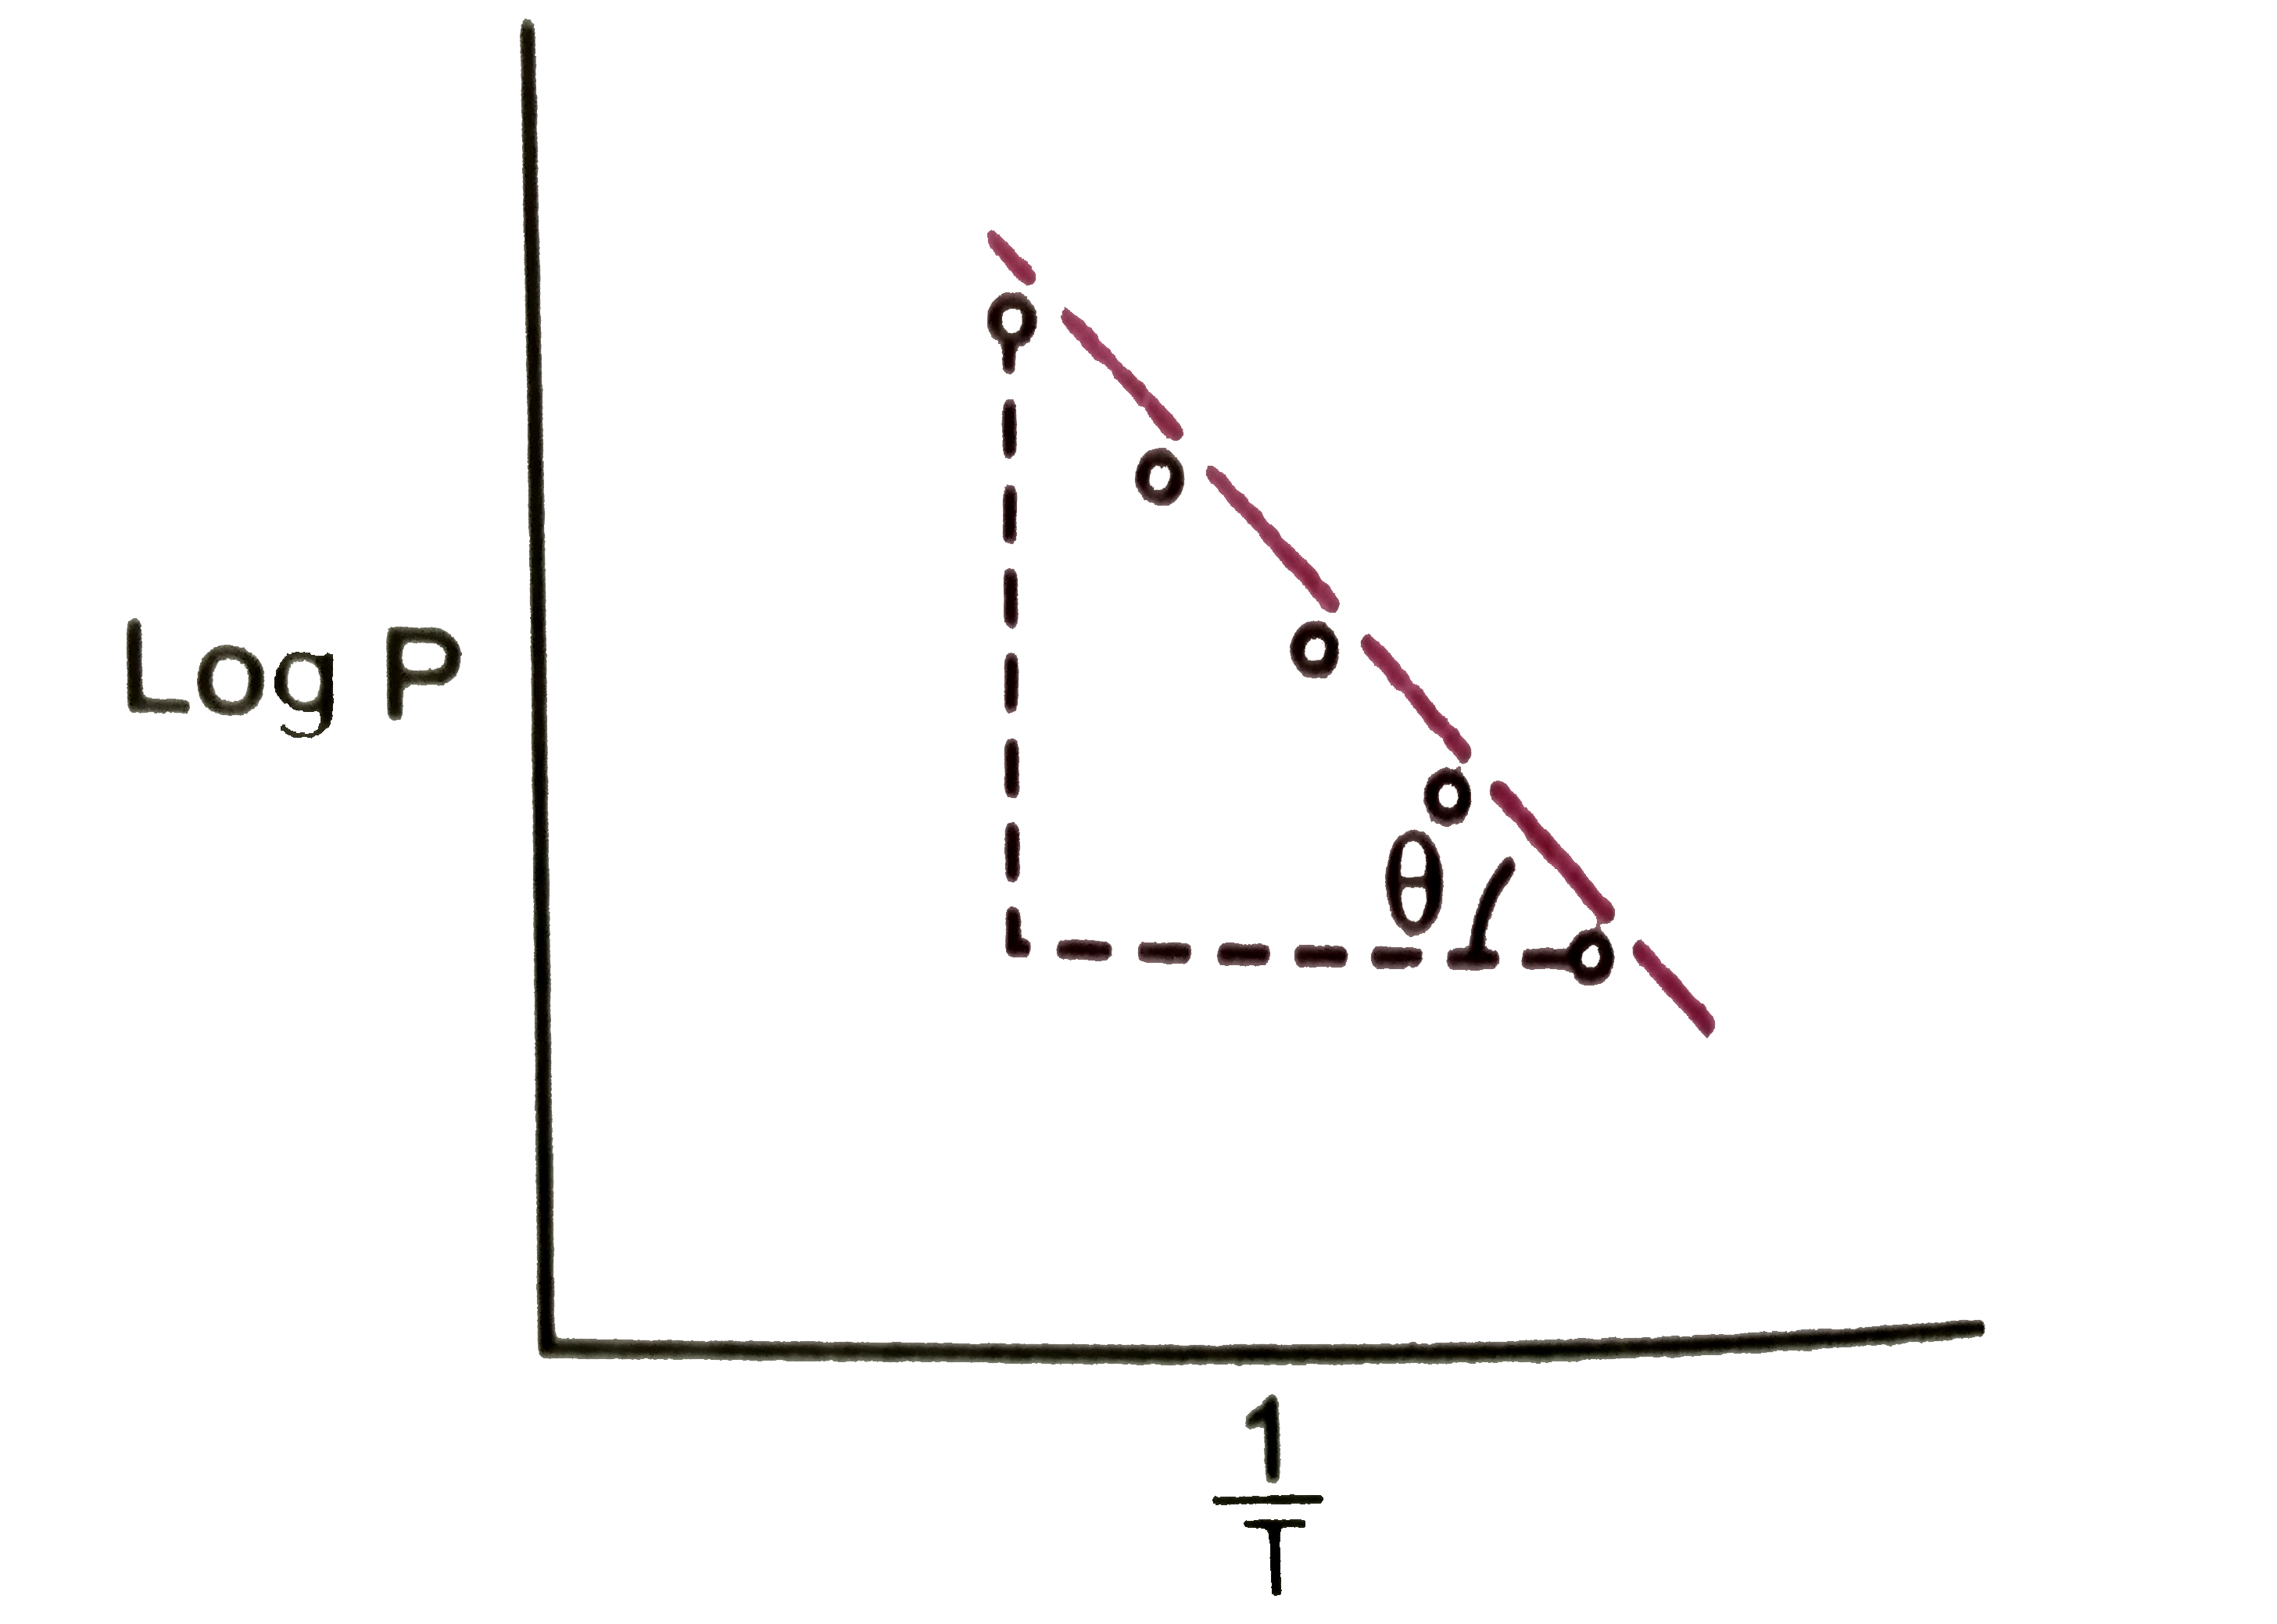
- The variation of vapour pressure with temperature for a liquid was stu...
Text Solution
|
- Surface tension of water is 73 dyne cm^(-1) at 20^(@)C. If surface are...
Text Solution
|
- Which values can be obtained from the information represented by the v...
Text Solution
|
- Choose the incorrect statement in the following :
Text Solution
|