A
B
C
D
Text Solution
Verified by Experts
The correct Answer is:


Topper's Solved these Questions
Similar Questions
Explore conceptually related problems
PRADEEP-MOTION-Paper-pen test
- (a) The distance time graph of a body is parallel to the time axis. Wh...
Text Solution
|
- The velocity time graph of a body is a straight line parallel to the t...
Text Solution
|
- Which of the following graphs represent a uniformaly accelerated motio...
Text Solution
|
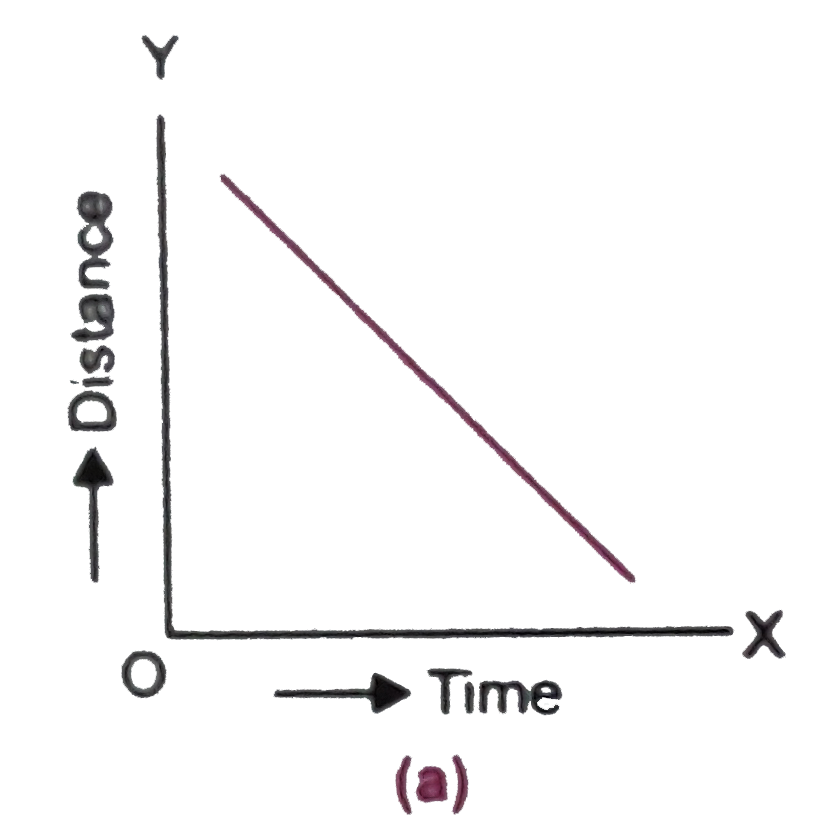
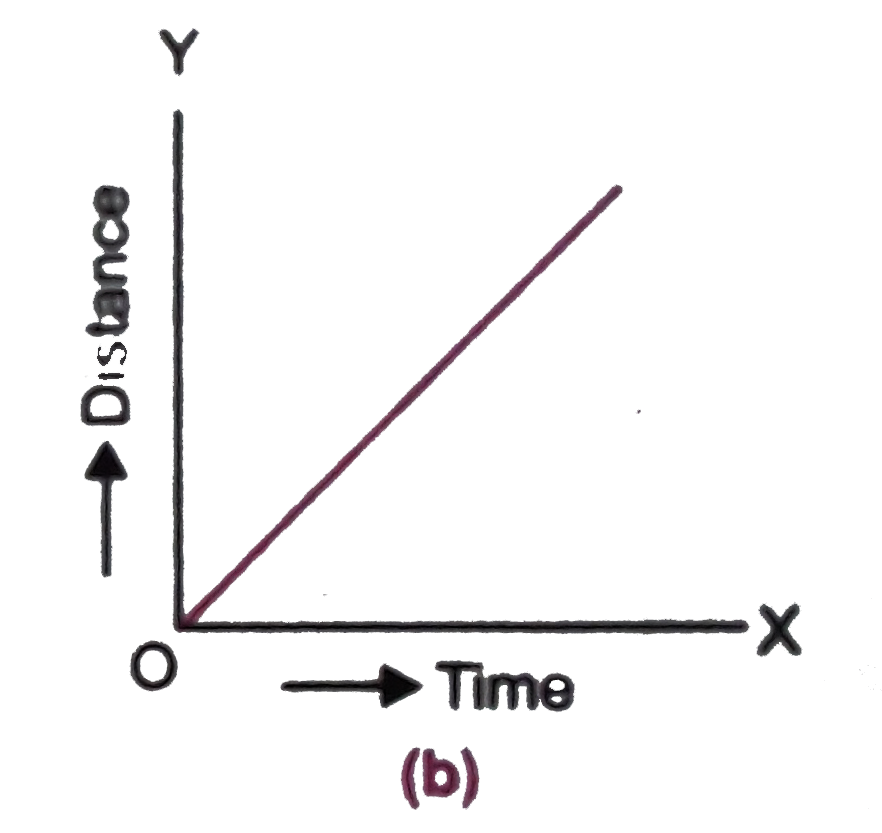
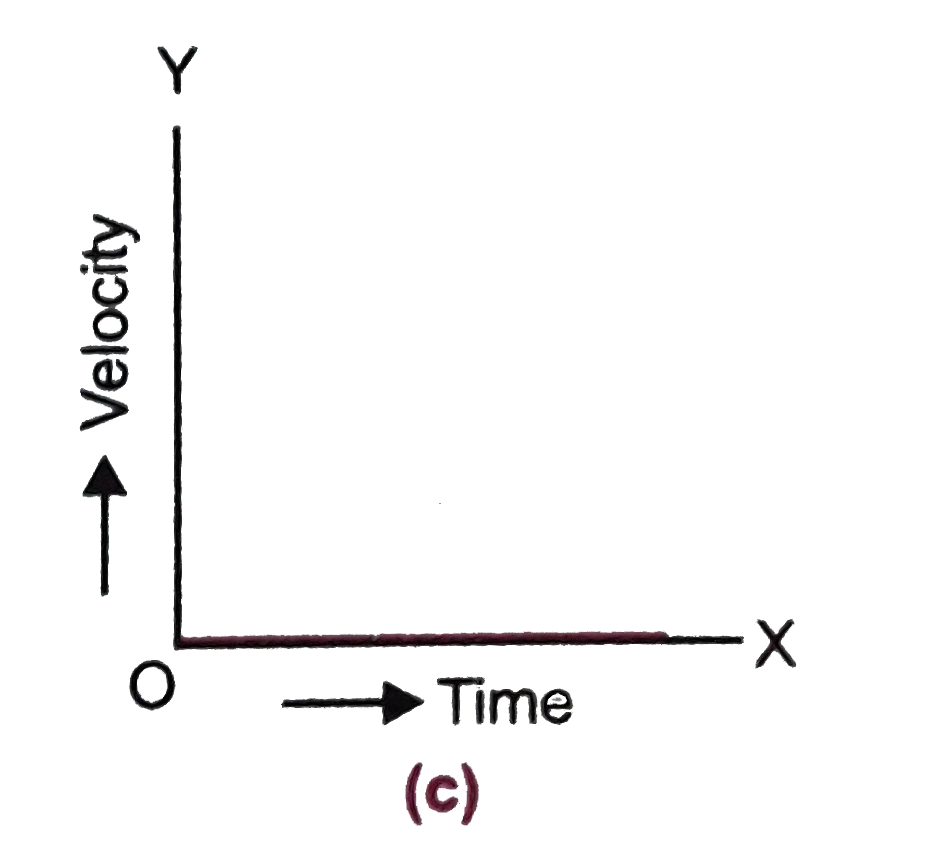
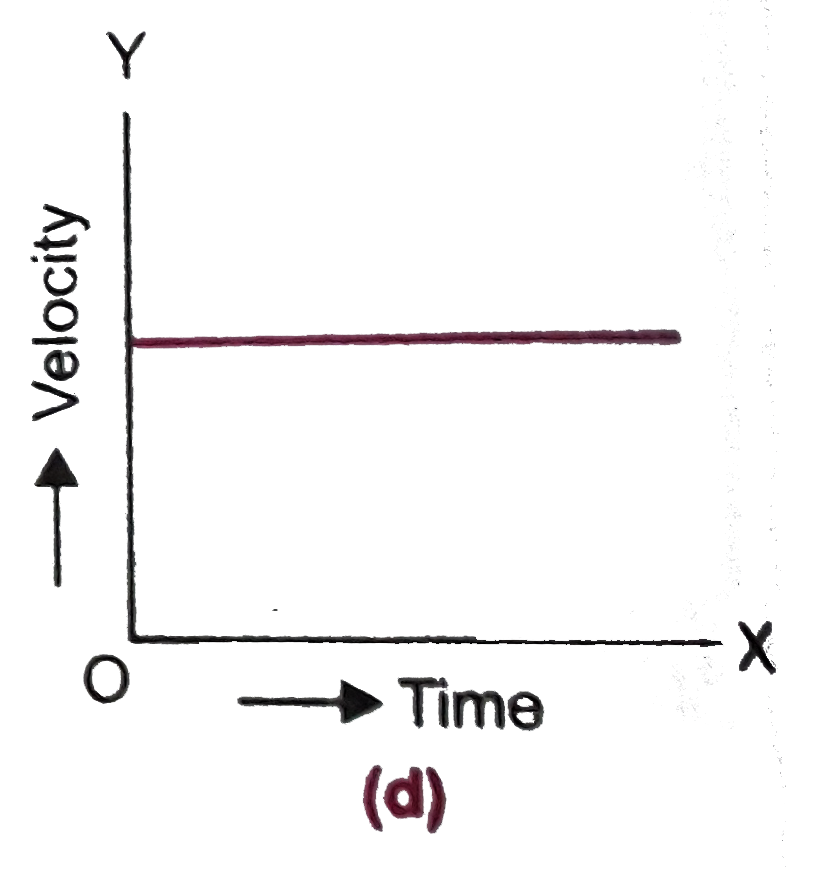
- Which of the following graphs represent abody at rest ?
Text Solution
|
- A body P moves with unifrom velocity and another body Q moves with uni...
Text Solution
|
- A body A starts from rest and moves with a uniform acceleration along ...
Text Solution
|
- (a) A body starting from rest moves with a constant acceleration of 5 ...
Text Solution
|
- The distance (s) travelled by a body in time (t) is given by s = ut + ...
Text Solution
|
- A body is thrown vertically upwards with a velocity of 98 m//s. If g =...
Text Solution
|
- The velocity time graph of a body represented as shown in Fig. Calcula...
Text Solution
|
- Draw a diagram to represent the direction of motion of a body moving a...
Text Solution
|
- A body is dropped vertically from a certain height. Draw velocity time...
Text Solution
|
- The distance time graph of a body is as shown in Figure. In which port...
Text Solution
|
- The speed time graph of a body is as shown in Figure. Calculate (i) ...
Text Solution
|
- Using velocity time graph, establish the relation s = ut + (1)/(2)at^(...
Text Solution
|