A
B
C
D
Text Solution
Verified by Experts
The correct Answer is:


Topper's Solved these Questions
Similar Questions
Explore conceptually related problems
A2Z-NUCLEAR PHYSICS-Radioactive Disintegration
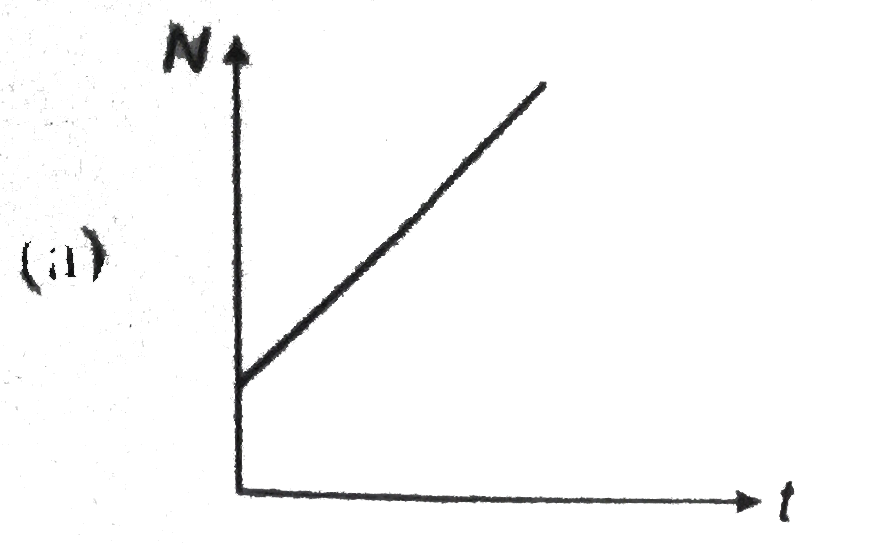
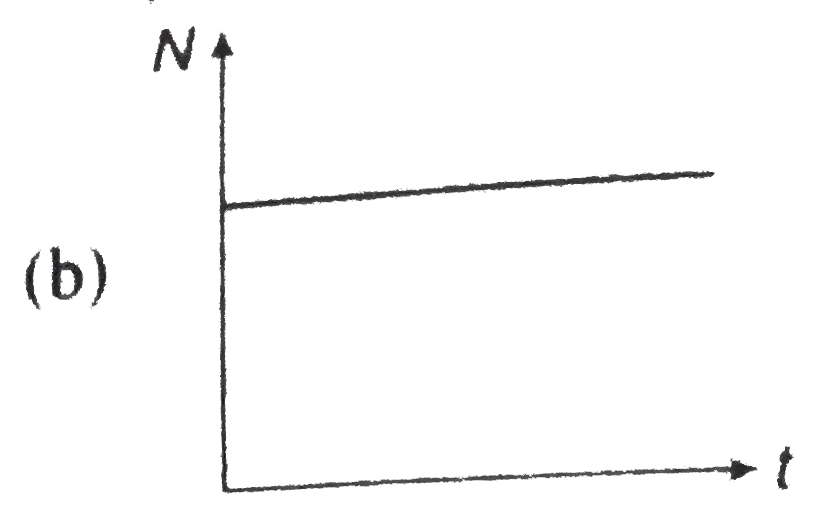
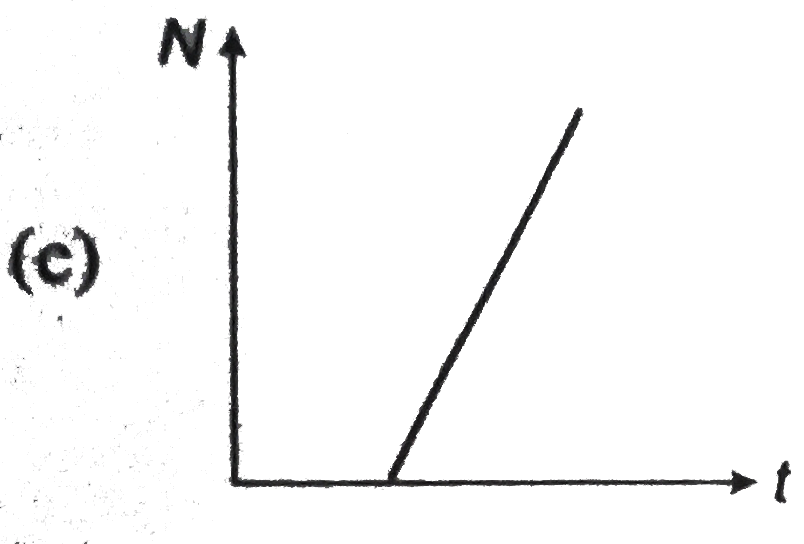
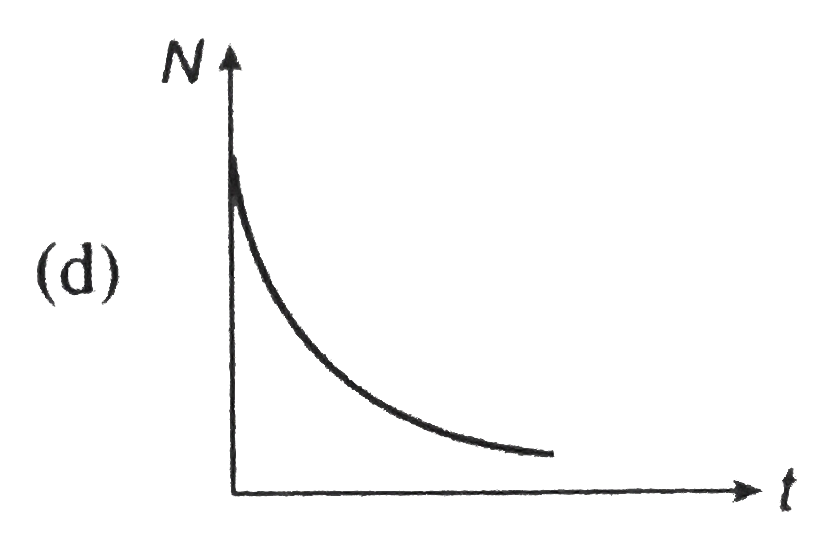
- The graph between the instantaneous concentration (N) of a radioactive...
Text Solution
|
- The curve between the activity A of a radioactive sample and the numbe...
Text Solution
|
- In a radioactive substance at t = 0, the number of atoms is 8 xx 10^4....
Text Solution
|
- The half-life period of radium is 1600 years. The fraction of a sample...
Text Solution
|
- The percentage of quantity of a radioactive material that remains afte...
Text Solution
|
- The radioactivity of a certain radioactive element drops to 1//64 of i...
Text Solution
|
- The average life T and the decay constant lamda of a radioactive nucle...
Text Solution
|
- If T is the half-life of a radioactive material, then the fraction tha...
Text Solution
|
- The half-life of a radioactive element which has only (1)/(32) of its ...
Text Solution
|
- The life-life of Bi^210 is 5 days. What time is taken by (7//8)^th par...
Text Solution
|
- A sample contains 16 gm of radioactive material, the half-life of whic...
Text Solution
|
- A radio-isotope has a half-life of 5 year. The fraction of the atoms ...
Text Solution
|
- The half-life of pononium is 140 days. After how many days. 16 gm polo...
Text Solution
|
- An archaeologist analyses the wood in a phehistoric structure and find...
Text Solution
|
- A radioactive element emits 200 particle per second. After three hours...
Text Solution
|
- The half-life of the isotope .11 Na^24 is 15 hrs. How much time does i...
Text Solution
|
- If 20 gm of a radioactive substance due to radioactive decay reduces t...
Text Solution
|
- A radioactive substance has a half life of 60 minutes. After 3 hours, ...
Text Solution
|
- After two hours, one-sixteenth of the starting amount if a certain rad...
Text Solution
|
- N atoms of a radioactive element emit n alpha particles per second. Th...
Text Solution
|