A
B
C
D
Text Solution
Verified by Experts
The correct Answer is:


Topper's Solved these Questions
SOLUTIONS
A2Z|Exercise Raoult'S Law, Ideal And Non-Ideal Solutions, Azeotropes|37 VideosSOLUTIONS
A2Z|Exercise Relative Lowering Of Vapour Pressure|24 VideosSOLUTIONS
A2Z|Exercise Section D - Chapter End Test|30 VideosSOLID STATE
A2Z|Exercise Section D - Chapter End Test|30 VideosSURFACE CHEMISTRY
A2Z|Exercise Section D - Chapter End Test|30 Videos
Similar Questions
Explore conceptually related problems
A2Z-SOLUTIONS-Vapour Pressure And Henry'S Law
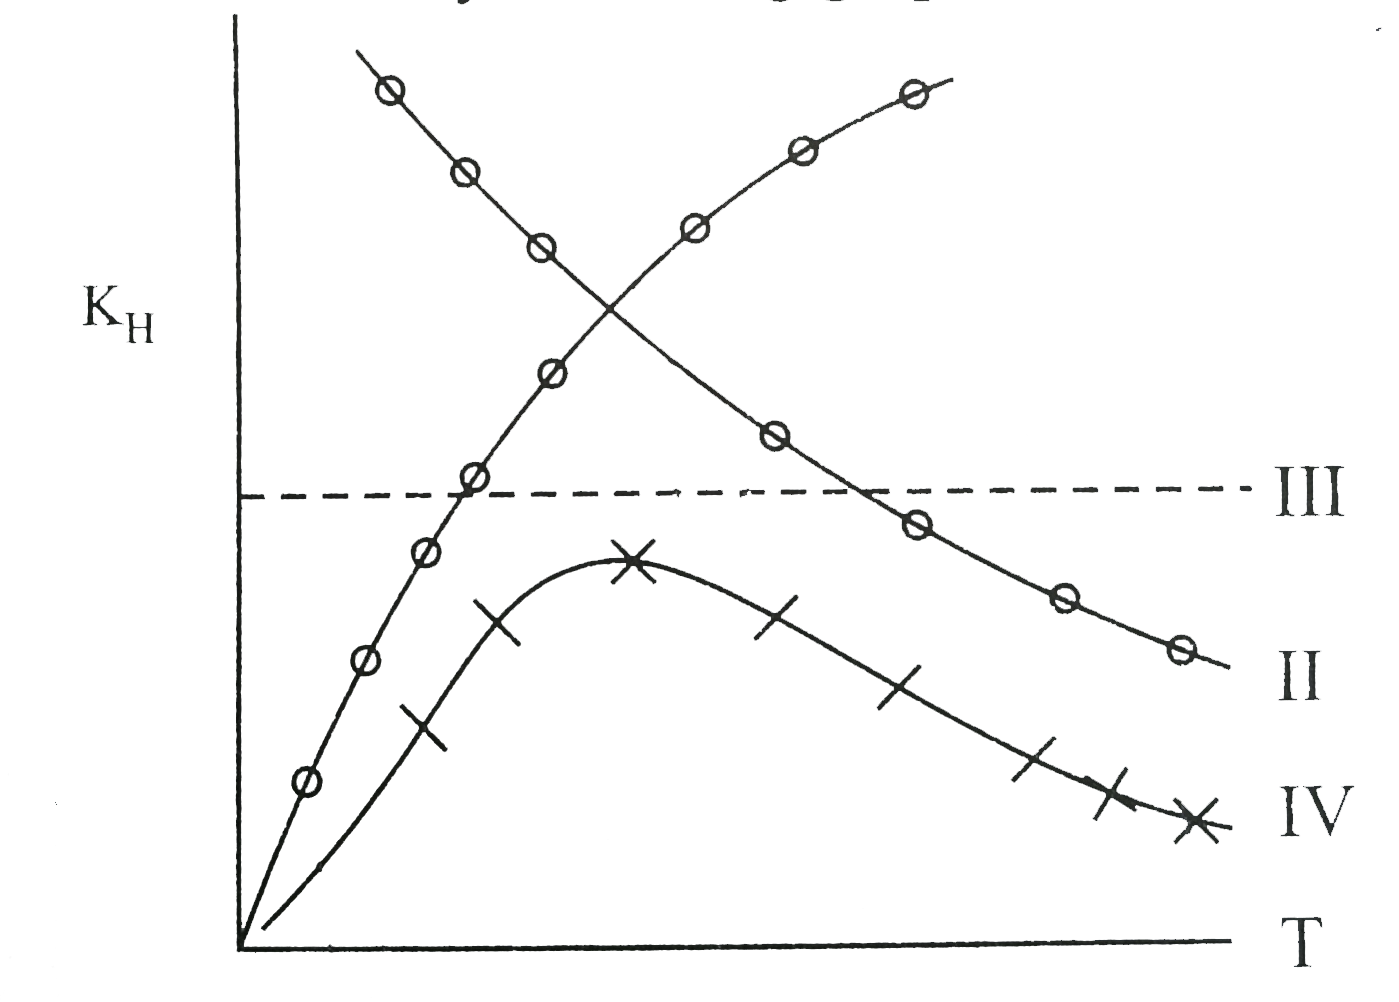
- Variation of K(H) (Henry's law constant) with temperature T is shown b...
Text Solution
|
- Which of the following units is useful in relating concentration of so...
Text Solution
|
- An unopened soda has an aqueous concentration of CO(2)at25^@equal to 0...
Text Solution
|
- Relation between the volume of gas (2) that dissolves in a fixed volum...
Text Solution
|
- The pressure under which liquid and vapour can co-exist at equilibrium...
Text Solution
|
- What is the concentration of O(2) in a freshwater stream in equilibriu...
Text Solution
|
- CO(g) is dissolved in H(2)O at 30^@C and 0.020 atm. Henry's law consta...
Text Solution
|
- The solubility of N(2)(g) in water exposed to the atmosphere, when the...
Text Solution
|
- The vapour pressure of a liquid in a closed container depends upon
Text Solution
|
- A sample of air saturated with benzene (vapour pressure = 100 mm Hg at...
Text Solution
|
- H(2)S gas is used in qualitative analysis of inorganic cations. Its so...
Text Solution
|
- Why does the use of pressure cooker reduce cooking time ?
Text Solution
|
- Observe the P-T phase diagrams for a given substance A. Then melting p...
Text Solution
|
- According to William Henry, the solubility of a gas in liquid depends ...
Text Solution
|
- A solid dissolves in water if
Text Solution
|
- The boiling points of C(6)H(6),CH(3)OH,C(6)H(5)NH(2) and C(6)H(5)NO(2)...
Text Solution
|
- During the evaporation of liquid
Text Solution
|
- At the higher altitudes the boiling point of water lowers because
Text Solution
|