A
B
C
D
Text Solution
Verified by Experts
The correct Answer is:


Topper's Solved these Questions
Similar Questions
Explore conceptually related problems
NARAYNA-KINETIC THEORY OF GASES-LEVEL-V
- During an experiment, an ideal gas is found to obey a condition (p^2)/...
Text Solution
|
- Pressure versus temperature graph of an ideal gas of equal number of m...
Text Solution
|
- One mole of an ideal gas undergoes a process P = P(0) [1 + ((2 V(0))/(...
Text Solution
|
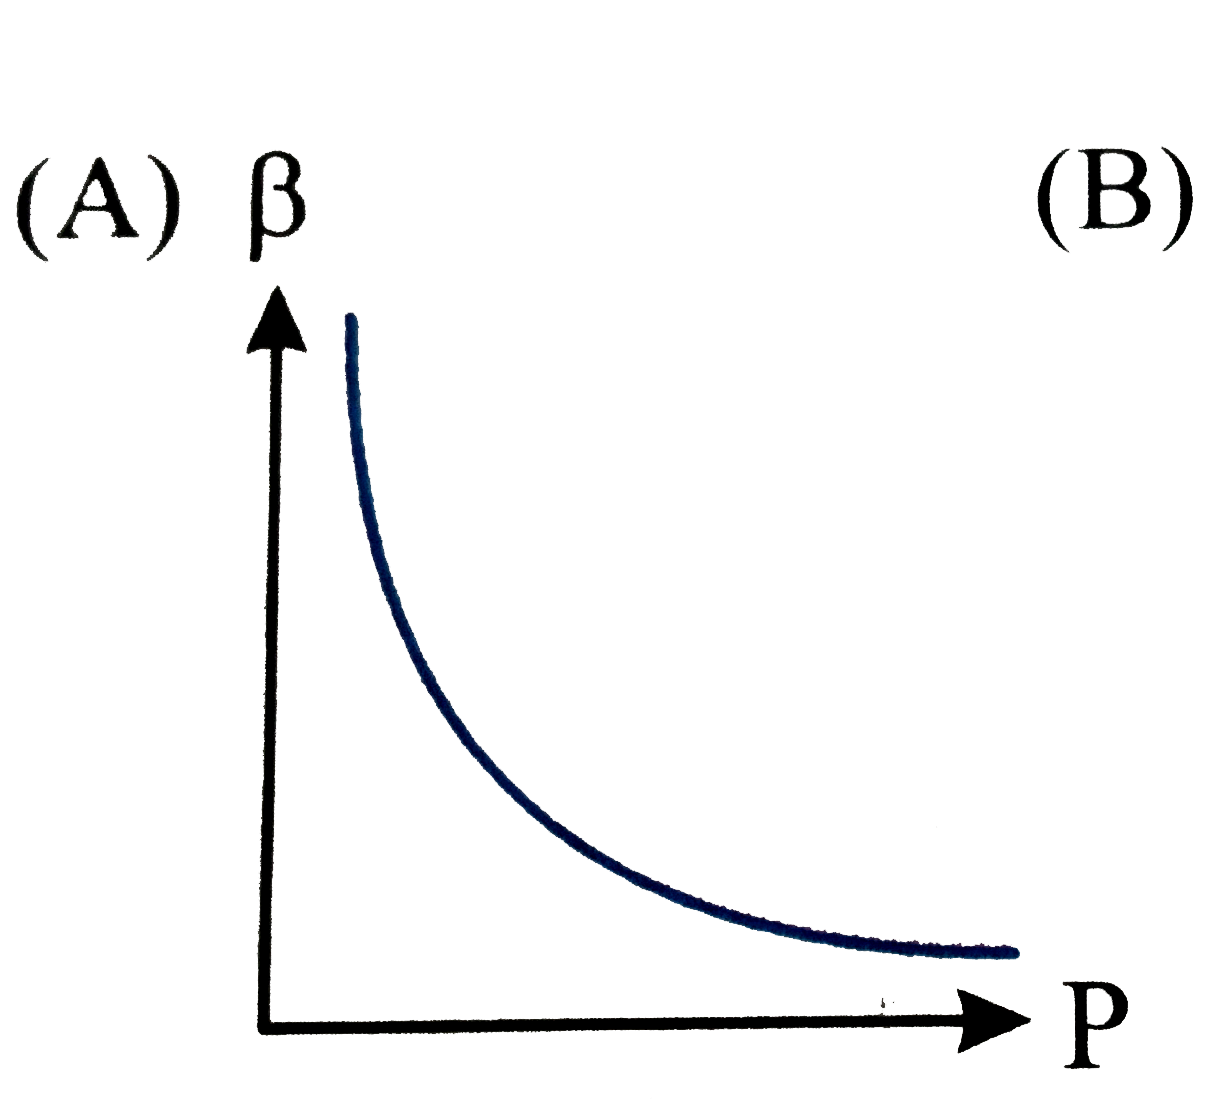
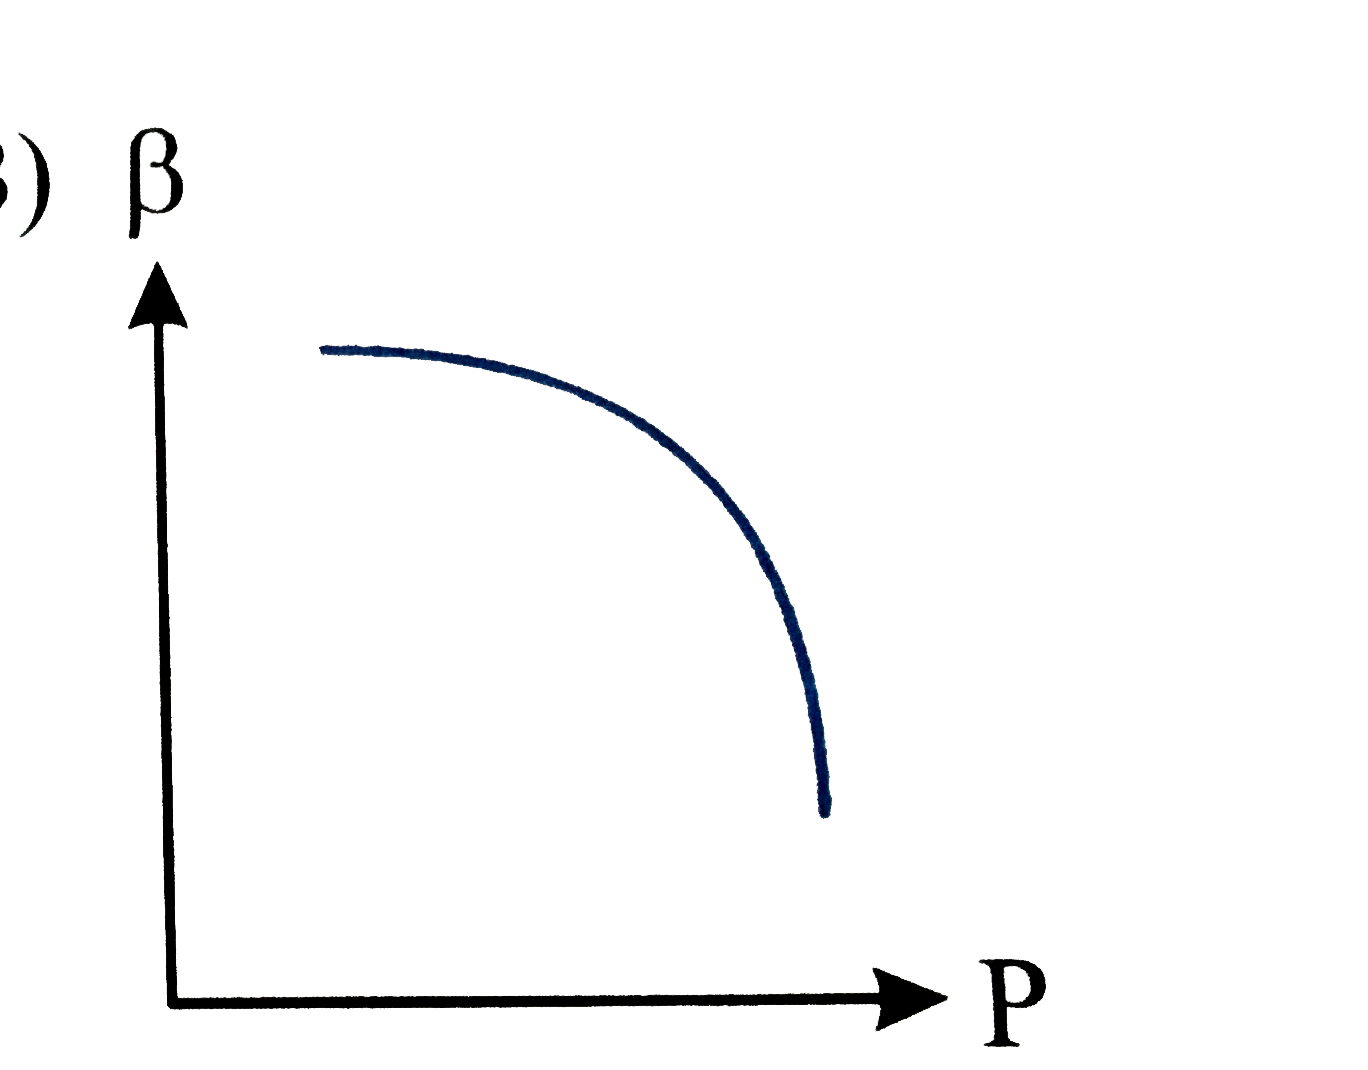
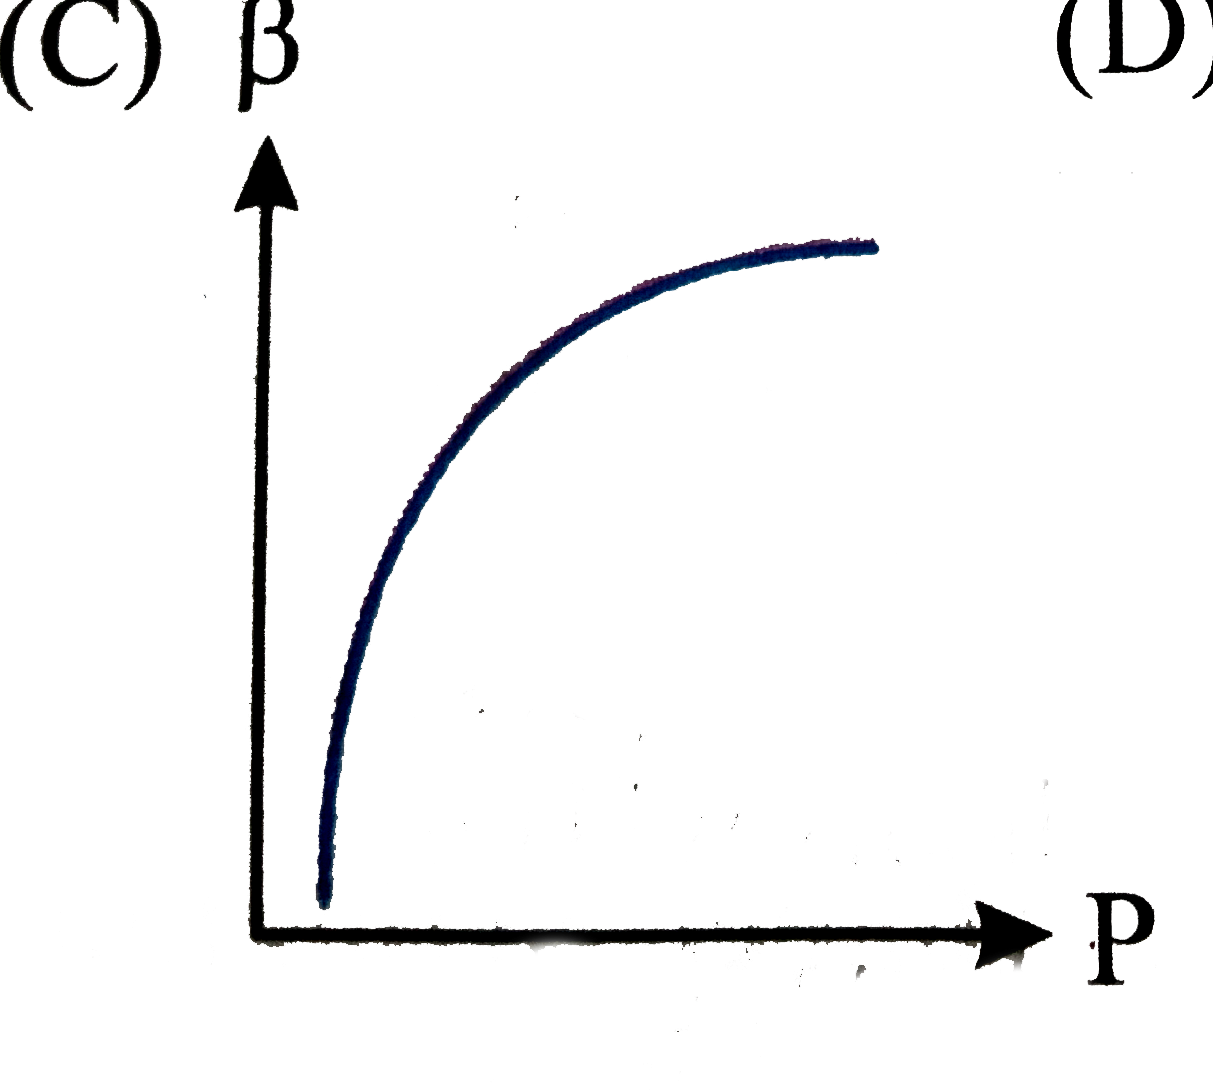
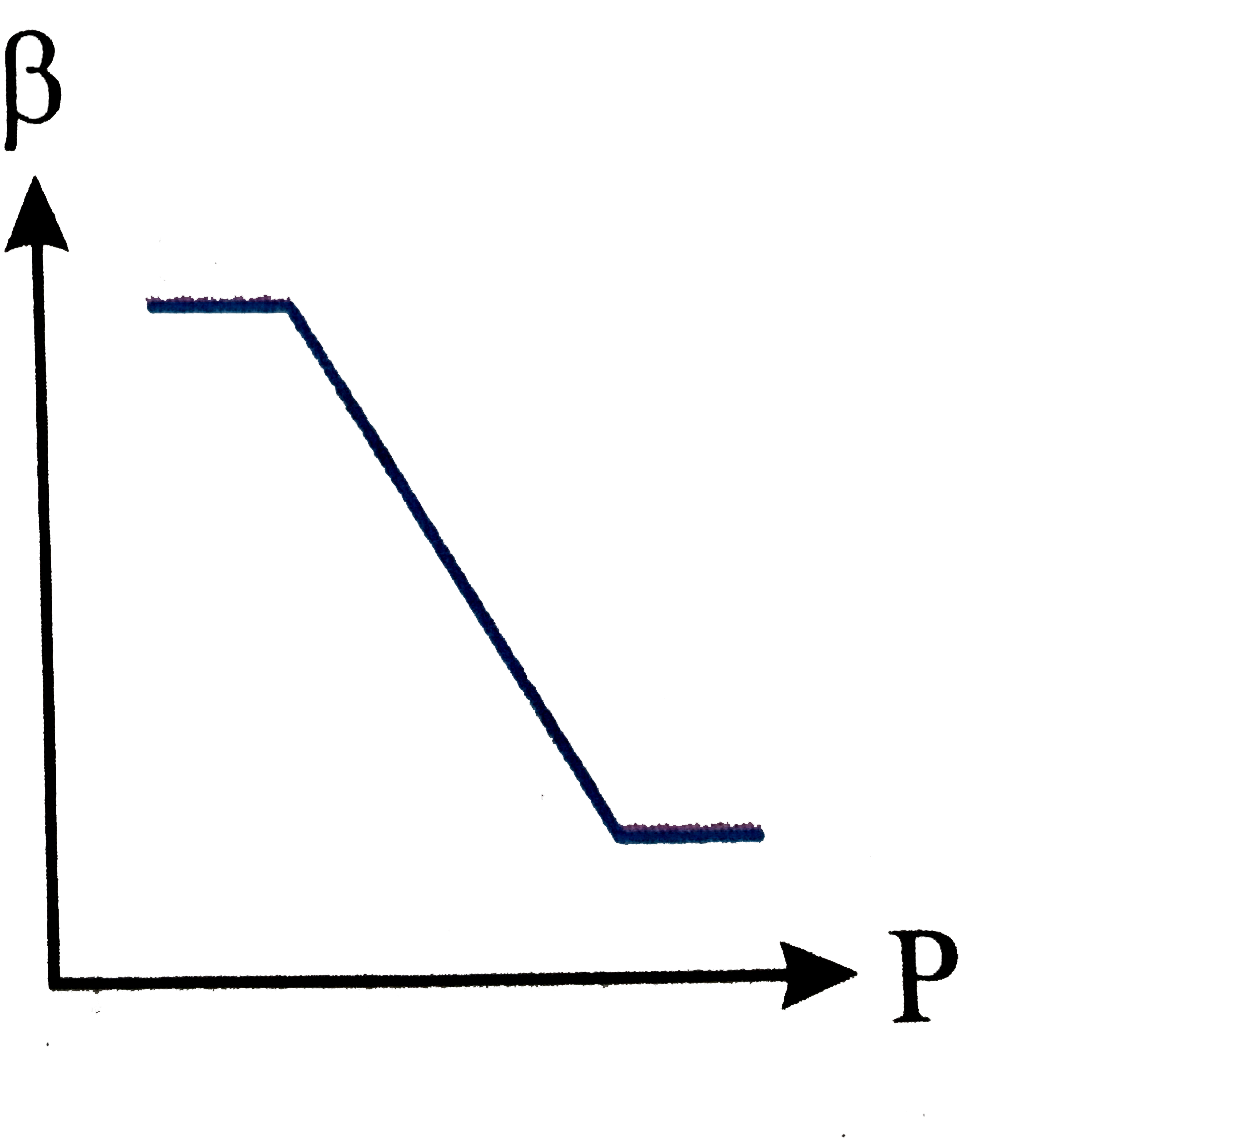
- Which of the following graphs correctly represents the variation of be...
Text Solution
|
- Pressure versus temperature graph of an ideal gas is shown in figure. ...
Text Solution
|
- An ideal gas is initially at temperature T and volume V. Its volume is...
Text Solution
|
- The air tight and smooth piston of a cylindrical vessel are connected ...
Text Solution
|
- A real gas behaves like an ideal gas if its
Text Solution
|
- Two cylinders fitted with pistons and placed as shown, connected with ...
Text Solution
|
- One mole of an ideal gas undergoes a process P = P(0) [1 + ((2 V(0))/(...
Text Solution
|