


KAPLAN-MATH TEST-01-Multiple Choice Question
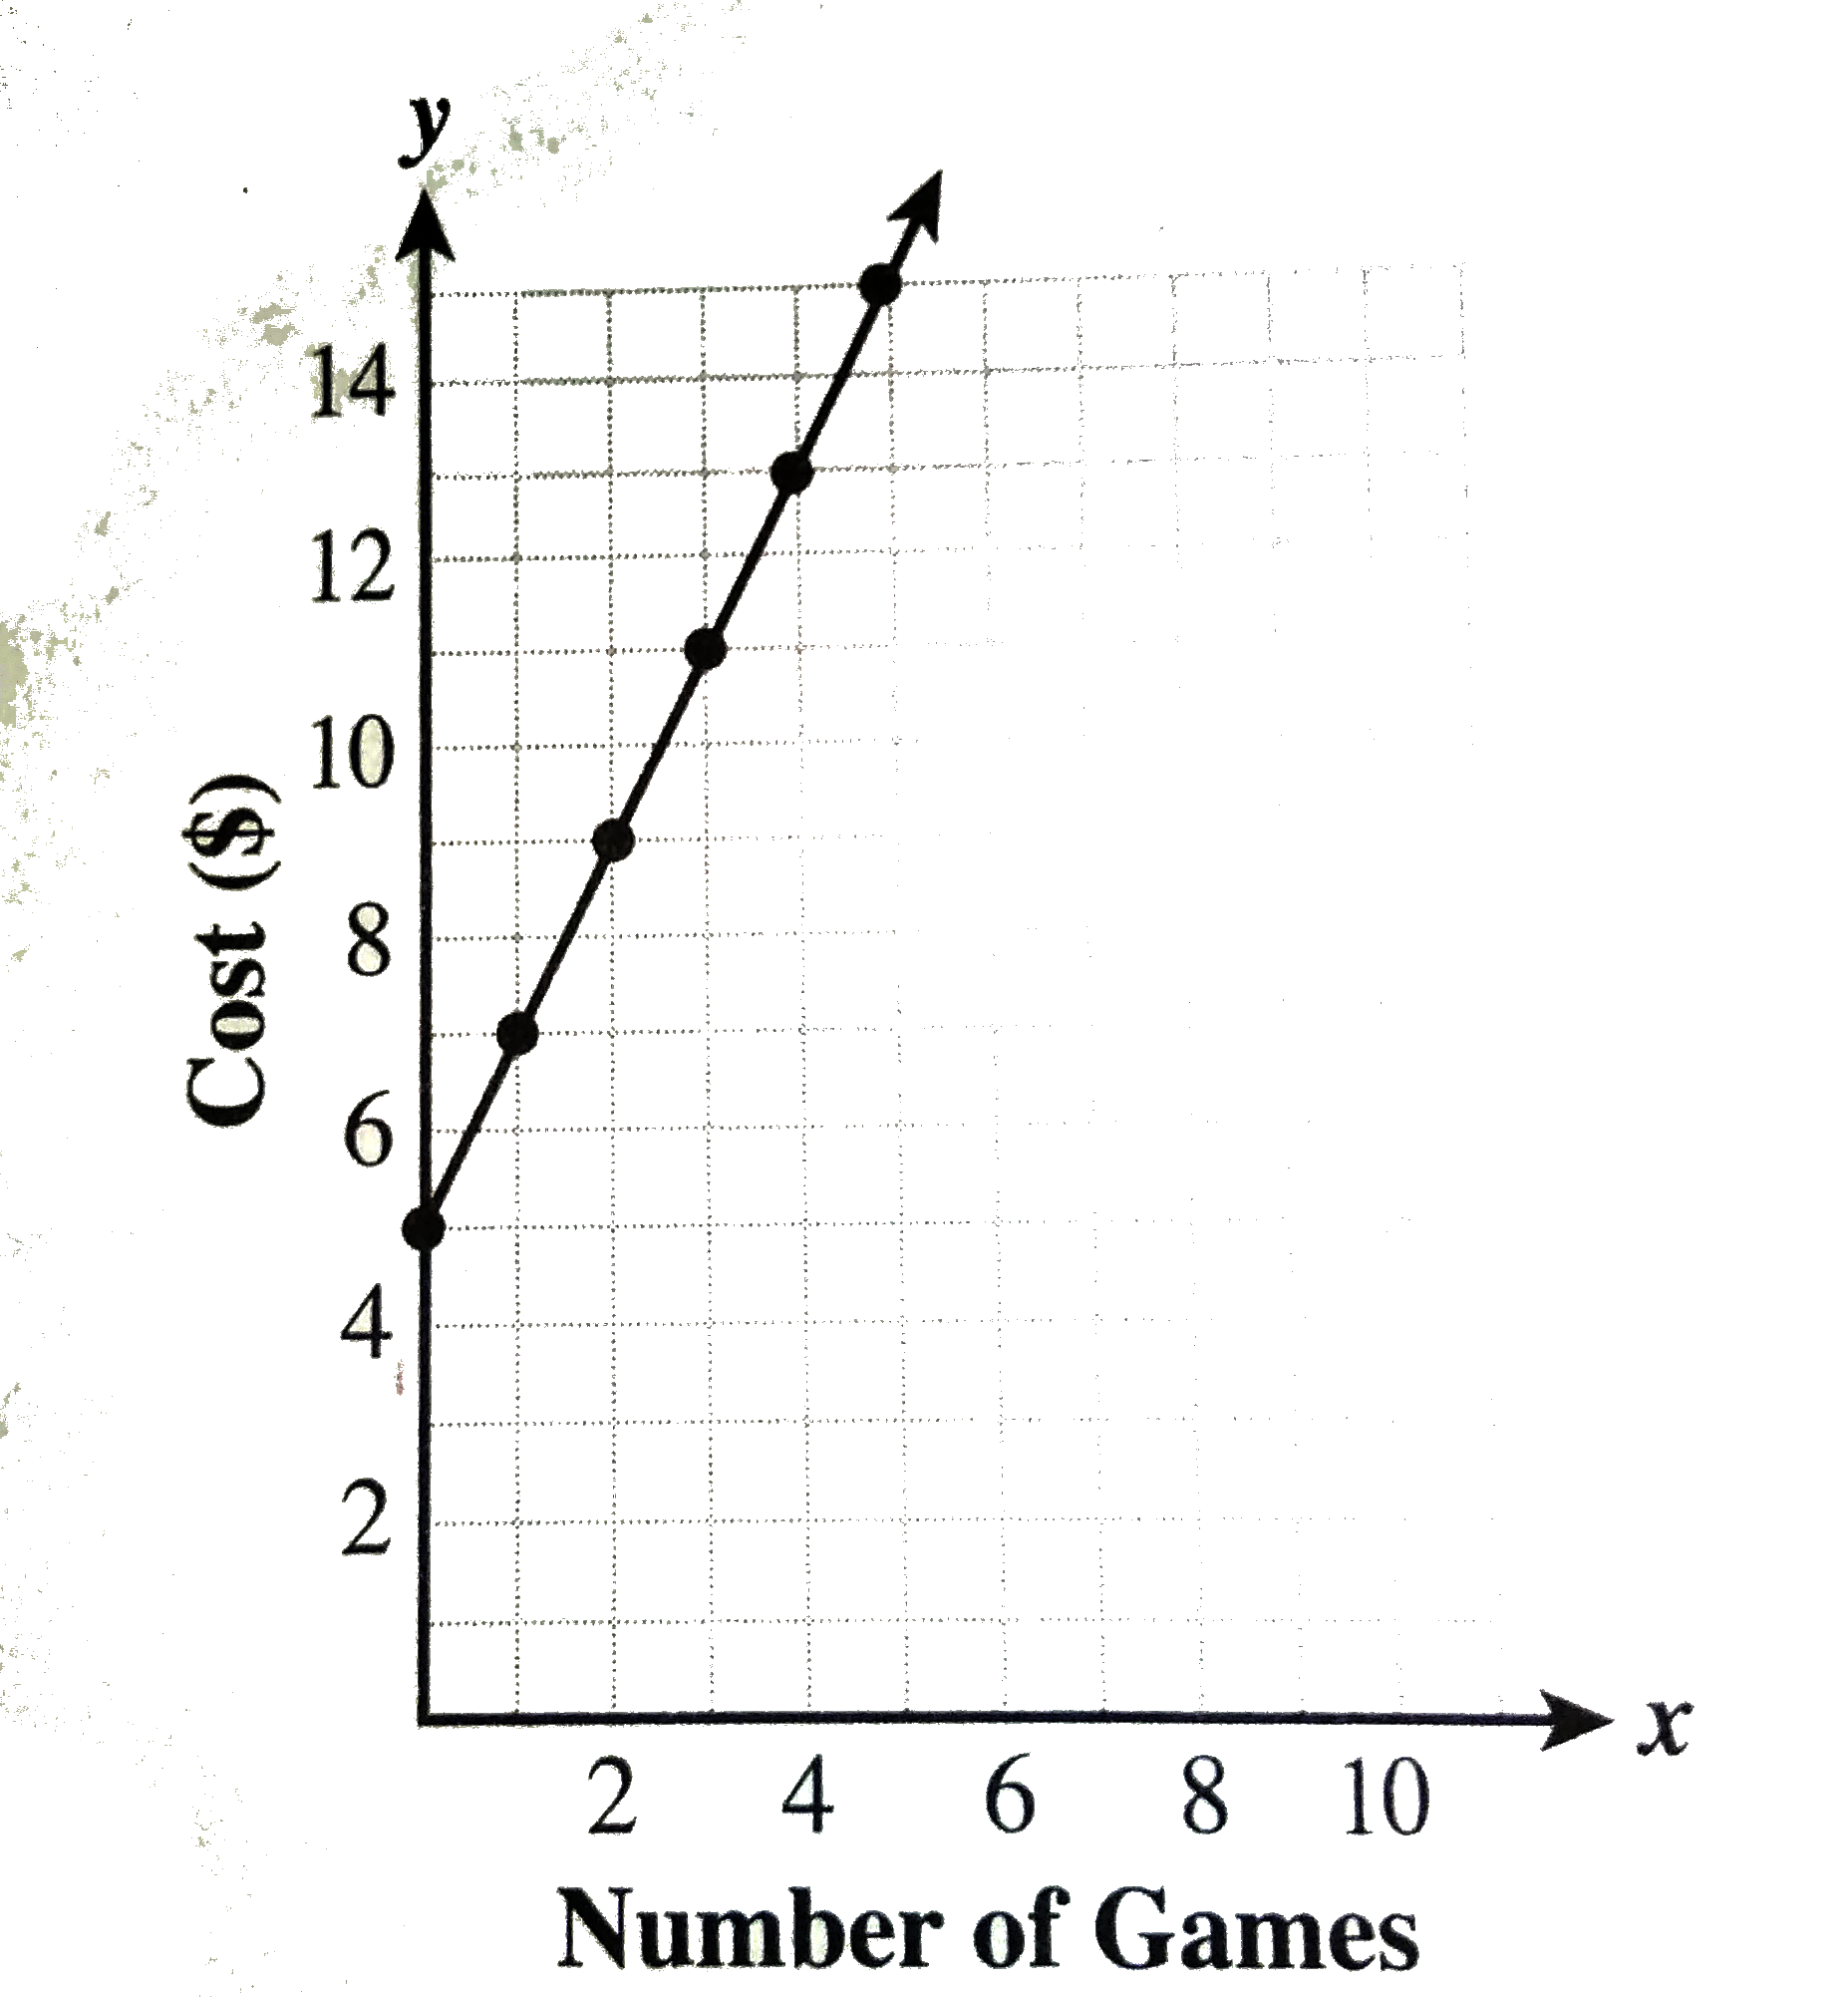
- The graph above shows the amount that a new, high-tech video arcade ch...
Text Solution
|
- (3x)/(x+5)÷(6)/(4x+20) Which of the following is equivalent to the e...
Text Solution
|
- (x+3)^(2)+(y+1)^(2)=25 The graph of the equation is a circle. What i...
Text Solution
|
- The figure above shows the graph of f(x). For which value(s) of x does...
Text Solution
|
- (4(d+3)-9)/(8)=(10-(2-d))/(6) In the equation above, what is the val...
Text Solution
|
- One indicator of a declining economy is a continued decline in birth r...
Text Solution
|
- The blue whale is the largest creature in the world and has been found...
Text Solution
|
- The figure above shows the straight-line depreciation of a laptop comp...
Text Solution
|
- What is the coefficient of x^(2) when 6x^(2)-(2)/(5)x+1 is multiplied ...
Text Solution
|
- The graph above could represent which of the following equations?
Text Solution
|
- {((3)/(4)x-(1)/(2)y=12), (kx-2y=22):} If the system of linear equati...
Text Solution
|
- In Delray Beach, Floride, you can take a luxury folf cart ride around ...
Text Solution
|
- The graph of g(x) is shown in the figure above. If h(x)=-g(x)+1, which...
Text Solution
|
- If a+bi represents the complex number that result from multiplying 3+2...
Text Solution
|
- 1/x+4/x=1/72 In order to create safe drinking water, cities and tow...
Text Solution
|
- if (1)/(4)x=5-(1)/(2)y, what is the value of x+2y? {(x+3yle18), (2x-...
Text Solution
|
- If (a, b) is a point in the solution region for the system of inequali...
Text Solution
|
- If x^(n) is the simplified form of the expression above, what is the v...
Text Solution
|
- In the figure above, the area of the shaded region is 52 square units...
Text Solution
|
- If y=ax^(2)+bx+c passes through the points (-3, 10), (0, 1), and (2, 1...
Text Solution
|