Home
Class 12
CHEMISTRY
P vs V graph is plotted for 1 mole of hy...

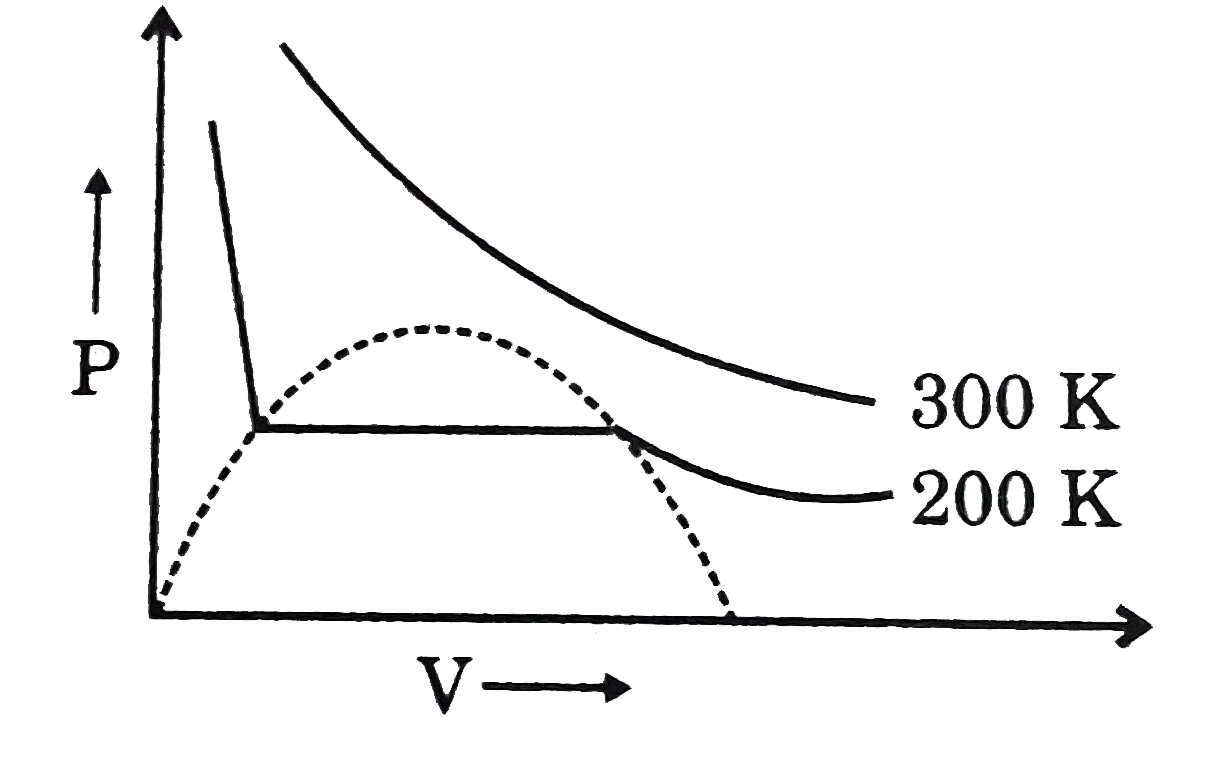
P vs V graph is plotted for 1 mole of hypothetical gas. Range of a/b for this gas in (atm-L/mole). `[R = 0.08 "atm-litre"//-"mle"-K]`

A

`54 lt ((a)/(b)) lt 81`

B

`27 lt ((a)/(b)) lt 42`

C

`40 lt ((a)/(b)) lt 65`

D

`13.5 lt ((a)/(b)) lt 40.5`

Text Solution

Verified by Experts

The correct Answer is:
A
Doubtnut Promotions Banner Mobile Dark
|

Topper's Solved these Questions

  • GRAPHICAL INTERPRETATION

    GRB PUBLICATION|Exercise Gaseous State|39 Videos
  • GRAPHICAL INTERPRETATION

    GRB PUBLICATION|Exercise C. Atomic Sturcture|1 Videos
  • GRAPHICAL INTERPRETATION

    GRB PUBLICATION|Exercise Thermodynamics|45 Videos
  • F-BLOCK ELEMENTS

    GRB PUBLICATION|Exercise Subjective type|7 Videos
  • HYDROCARBON (ALIPHATIC)

    GRB PUBLICATION|Exercise Previous years jee questions|28 Videos

Similar Questions

Explore conceptually related problems
For a fixes amount of real gas when a graph of z v//s was plotted than at very high pressure slope was observed to be 0.01 atm^(-1) . At the same temperature if a graph is plotted b//w pv v//s P then for 2 moles of the gas 'Y' intercept is found to be 40 atm-litre. calculate excluded volume in litres for 20 moles of the real gas.

For a fixed amount of a real gas when a graph of Z us P was plotted then at very high pressure slope was observed to be 0.01 atm^(-1) . At the same temperature if a graph is plotted between PV us P then for 2 moles of the gas the y intercept is found to be 40 atm-litre. Calculate excluded volume in litres for 20 moles of the real gas/

Knowledge Check

  • Z us P graph is plotted for 1 mole of hypothetical gas. Volume of gas at this point A is: [R = 0.08 atm L//"mole"-K]

    A
    `0.01L`
    B
    `0.09L`
    C
    `0.064 L`
    D
    `0.64L`
  • Above graph is plotted for 1 mole of ideal monoatomic gas. Correct relation of V_(A) "and" V_(B) will be :

    A
    `(V_(B))/(V_(A))=1/1`
    B
    `(V_(B))/(V_(A))=2/1`
    C
    `(V_(B))/(V_(A))=1/2`
    D
    none of these
  • Consider the given graph: Graph is plotted for 1 mol of gas at 400K, find slope of curve [take: R = 0.08(L-atm)/(mol-K)]

    A
    `(32)^(2)`
    B
    `(16)^(2)`
    C
    `(8)^(2)`
    D
    `(4)^(2)`
  • Similar Questions

    Explore conceptually related problems

    Calculate the magnitude of work done (in atm lit.) for the given cyclic process involing 1 mole of an ideal gas .[Given : R =0.08 atm lit./mole /k]

    The volume of 10 "moles" of an ideal gas at 10 atm and 500 K is

    Kinetic energy of 0.30 moles of He gas In a container of maximum capacity of 4 litres at 5 atmosphere, must be (R = 0.0821 atm litre "mole"^(-1) K^(-1) )

    The volume vs. temperature graph of 1 mole of an ideal gas is given below The pressure of the gas (in atm) at X, Y and Z, respectively, are

    If the graph is plotted for 1 mole gas in such a way that PV is plotted against 'P', then intercept of the graph for real gas will be: