A
B
C
D
Text Solution
Verified by Experts
The correct Answer is:


Topper's Solved these Questions
GRAPHICAL INTERPRETATION
GRB PUBLICATION|Exercise Comprehension 1|1 VideosGRAPHICAL INTERPRETATION
GRB PUBLICATION|Exercise Comprehension|49 VideosGRAPHICAL INTERPRETATION
GRB PUBLICATION|Exercise Electrochemistry|9 VideosF-BLOCK ELEMENTS
GRB PUBLICATION|Exercise Subjective type|7 VideosHYDROCARBON (ALIPHATIC)
GRB PUBLICATION|Exercise Previous years jee questions|28 Videos
Similar Questions
Explore conceptually related problems
GRB PUBLICATION-GRAPHICAL INTERPRETATION-Multiple Objective Type
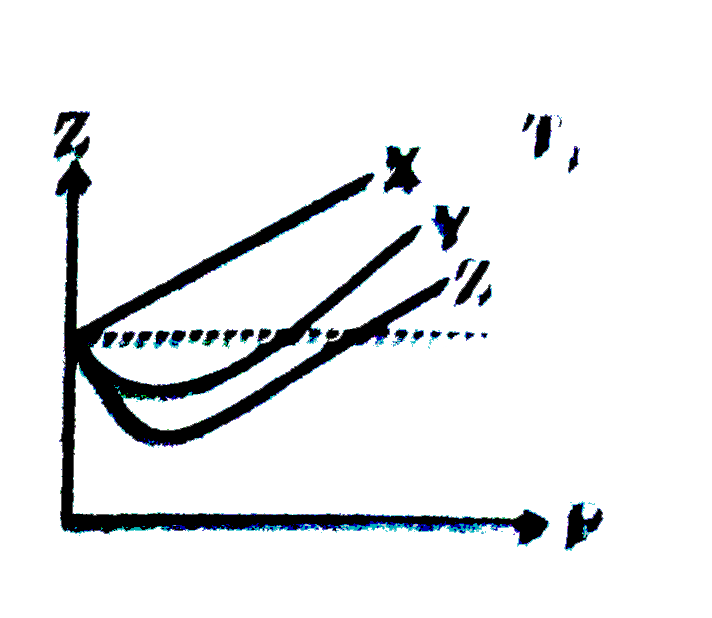
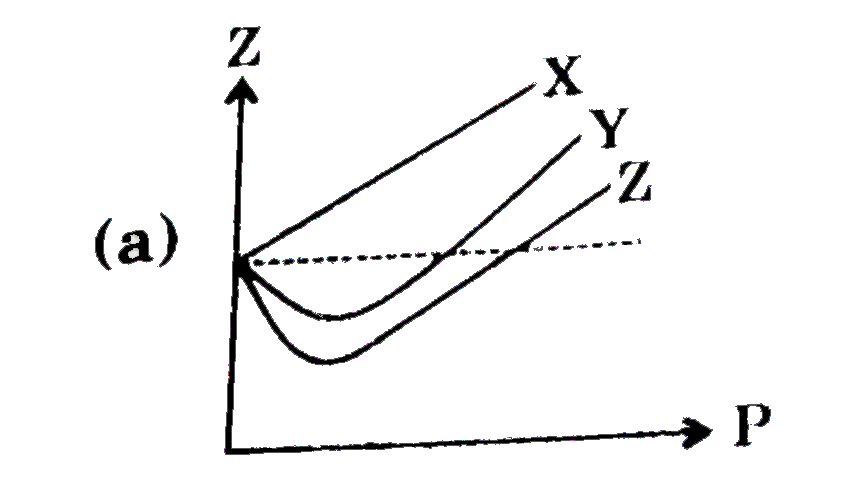
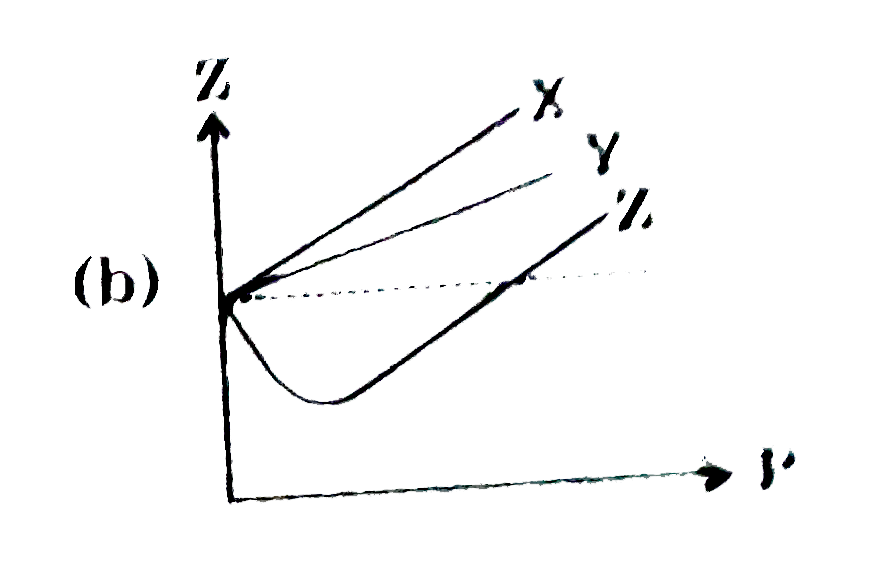
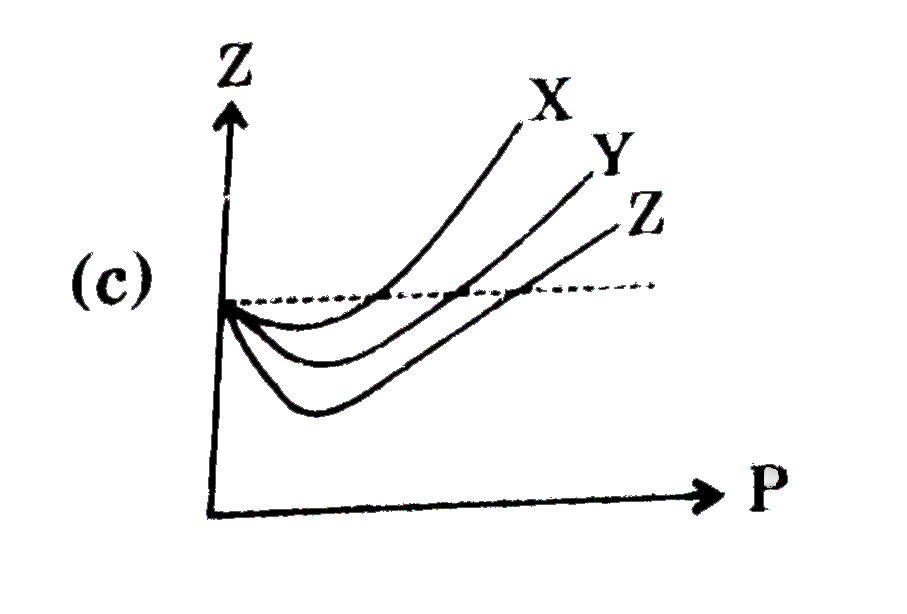
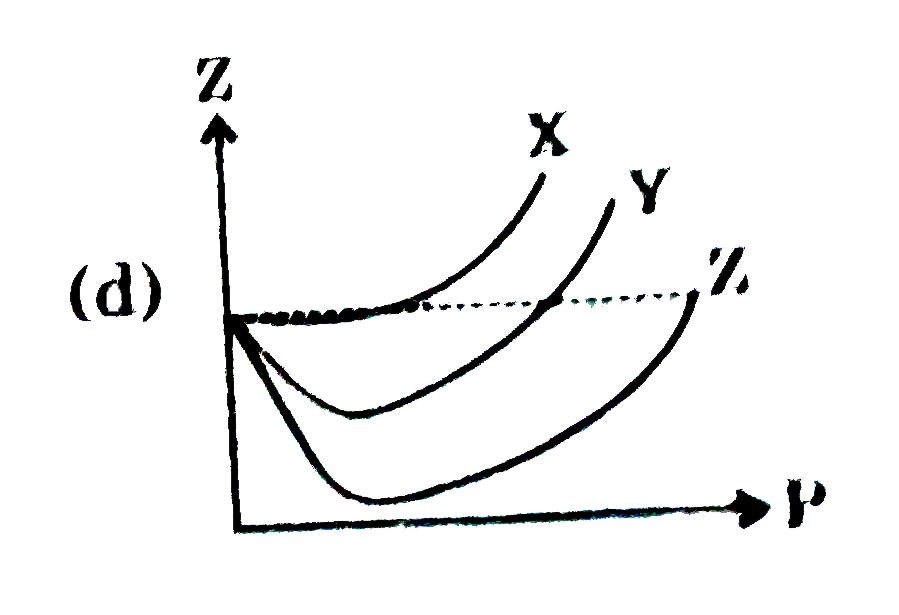
- Z vs P is plotted for 1 mole of three different gases X,Y and Z at tem...
Text Solution
|
- A liqud mixture of two volatile liquids has composition corresponding ...
Text Solution
|
- For the following graph, drawn from two different samples of gases at ...
Text Solution
|
- In the above Maxwellian plot at two different temperatures which of th...
Text Solution
|
- Figure displays the plot of the compression factor Z versus P for a fe...
Text Solution
|
- For gaseous state at constant temperature which of the following plot ...
Text Solution
|
- Titration curves for 0.1 M solutions of three weak acids HA(1),HA(2) a...
Text Solution
|
- When weak base solution (50 ml of 0.1 NH(4)OH) is titrated with strong...
Text Solution
|
- Which one is the correct graph (fig.) for the corresponding acid base ...
Text Solution
|
- A weak acid (or base) is titrated against a strong base (or acid), vol...
Text Solution
|
- For a general substance A the phase diagram is represented as shown. I...
Text Solution
|
- Consider the following first order decomposition and the accompanying ...
Text Solution
|
- Which of the following statement are true regarding the log K vs 1//T....
Text Solution
|
- For a second order reaction, plots are made for (1)/([A]) us time for ...
Text Solution
|
- Consider the decay of P to A and B by two parallel first order reactio...
Text Solution
|
- For a reaction 2A +B rarr C following information is known. Identify t...
Text Solution
|
- Identify the correct statement (s).
Text Solution
|
- From the graph of binding energy (B.E.) usmass number plotted as shown...
Text Solution
|
- The following graph is experimentally obtained for the reaction : A ra...
Text Solution
|
- Given plot is valied, for which of the following reaction ?
Text Solution
|