Home
Class 12
MATHS
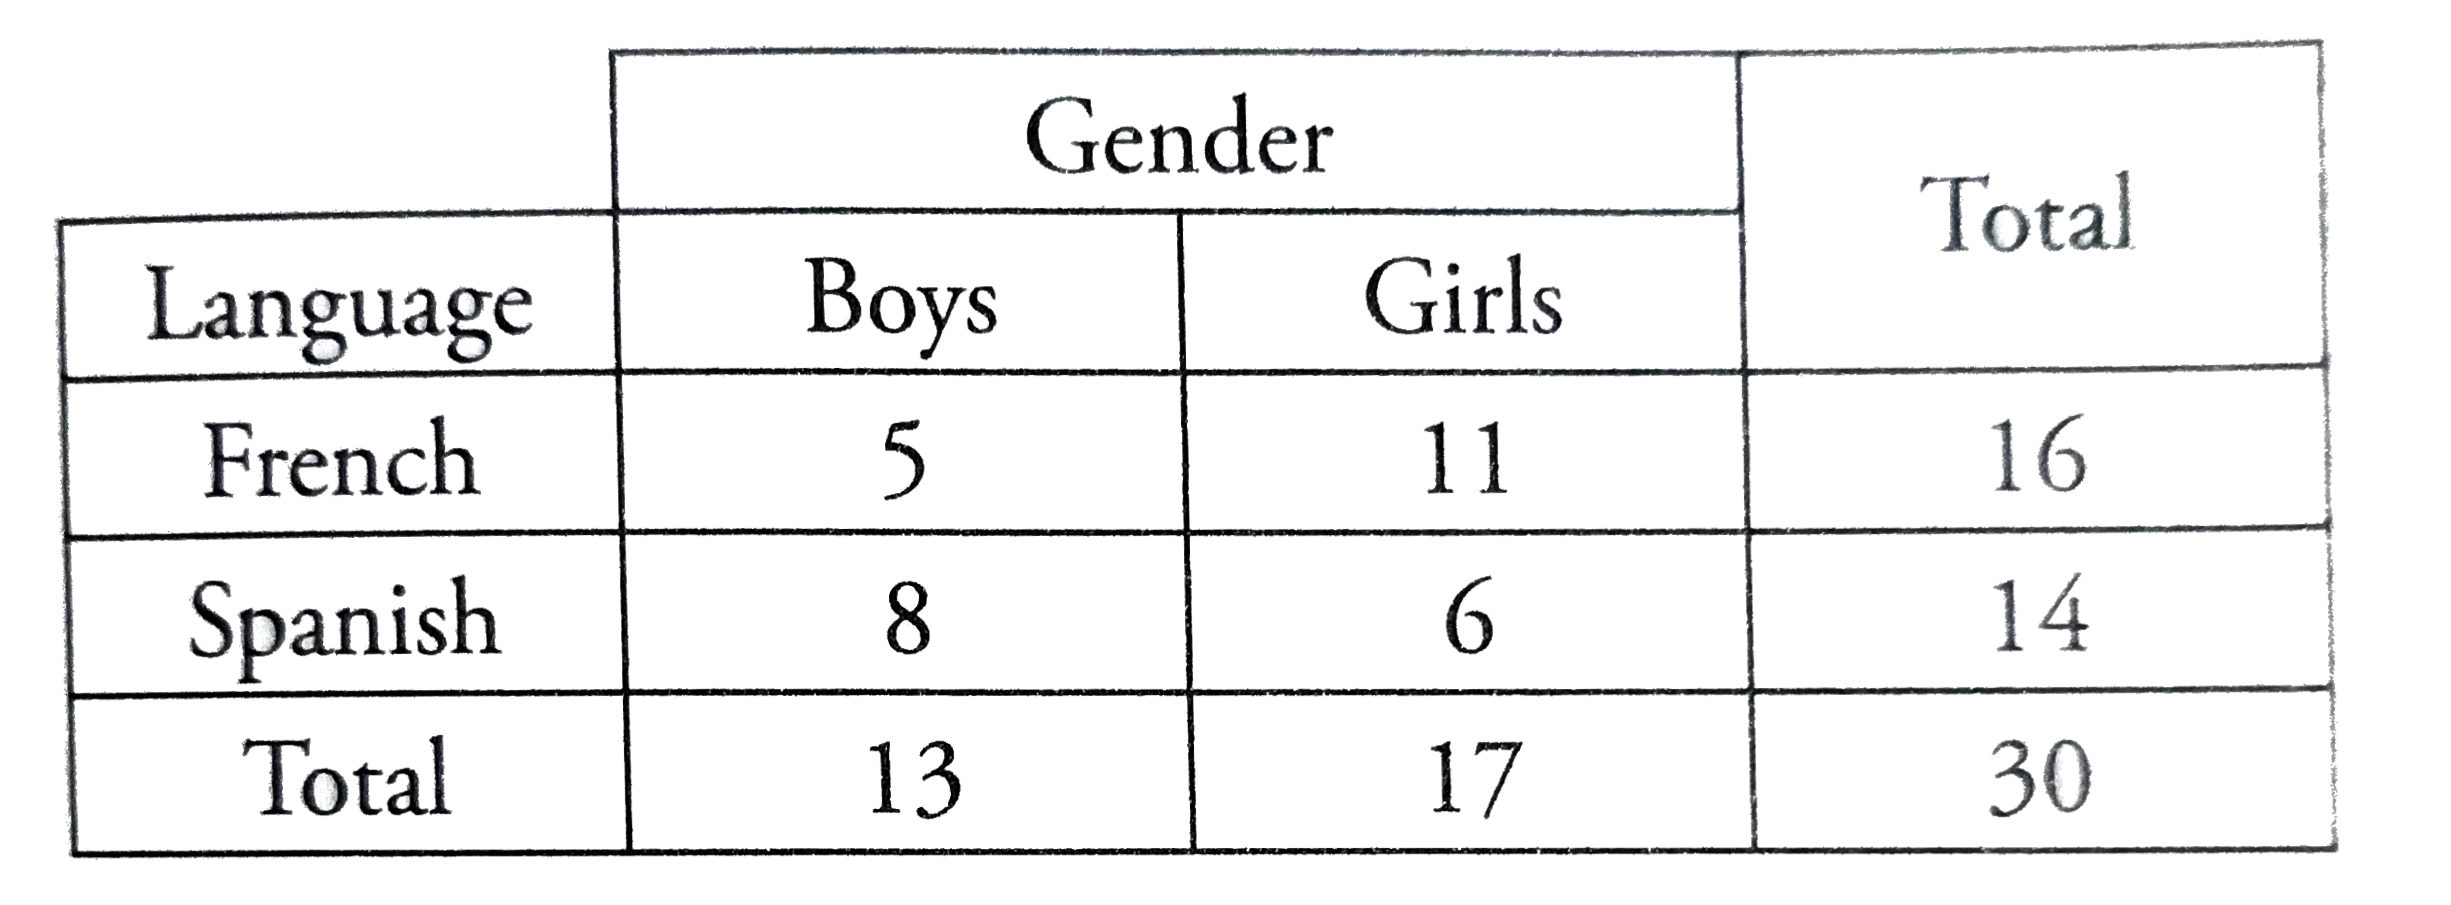
The table above shows the distribution o...


The table above shows the distribution of the gender and the language studied of the 30 students in an after-school language program. If a student is chosen at random, what is the probability that the student will be either a boy studying French or a girl studying Spanish?

A

`(3)/(30)`

B

`(10)/(30)`

C

`(11)/(30)`

D

`(13)/(30)`

Text Solution

Verified by Experts

The correct Answer is:
C
Doubtnut Promotions Banner Mobile Dark
|

Topper's Solved these Questions

  • ARITHMETIC

    PRINCETON|Exercise QUICK QUIZ #11|3 Videos
  • ARITHMETIC

    PRINCETON|Exercise QUICK QUIZ #9|4 Videos
  • ALGEBRA: CRACKING THE SYSTEM

    PRINCETON|Exercise Algebra Drill 2: Calculator-Permitted Section|6 Videos
  • FUN WITH FUNDAMENTALS

    PRINCETON|Exercise Fundamental Drill 2: Calculator- Permitted Section|6 Videos

Similar Questions

Explore conceptually related problems
A class has 20 girls and 16 boys. One student is selected at random. Find the probability that the student is a girl.

In a class of 50 students, 20 are boys and rest are girls. A student is selected at random. Find the probability of selecting a boy.

Knowledge Check

  • The cumulative histrogram above shows the distribution of scores that 24 students received on an English test. If a students is selected at random, what is the probability that the student will have a score between 71 and 80?

    A
    `(1)/(6)`
    B
    `(1)/(3)`
    C
    `(1)/(2)`
    D
    `(2)/(3)`
  • The table above shows the distribution of age and gender for 25 people who entered a contest. If the contest winner will be selected at random, what is them probability that the winner will be either a female under age 40 or a male age 40 or older?

    A
    `4/25`
    B
    `10/25`
    C
    `11/25`
    D
    `16/25`
  • A class has 12 boys and 4 girls. If three students are selected at random from the class, what is the probability that all will be boys?

    A
    `1/55`
    B
    `1/4`
    C
    `1/3`
    D
    `11/28`
  • Similar Questions

    Explore conceptually related problems

    In a school, 300 students were surveyed. The survey showed that 186 students liked watching cricket match while the rest disliked it. Out of these students, if one student is chosen at random, what is the probability that the chosen student : (i) likes watching cricket match? (ii) dislikes watching cricket match?

    The student attendance record for a class in a one-semester course is shown above. If 2 students are chosen at random, what is the probability , to the nearest hundredth , that both students have fewer than 2 absences ?

    The frequency chart shows test scores for a certain class. The total number of student is 31. If a student in the class was picked at random , what is the probability that the student's score was below 71 ?

    Question 4-6 refer to the above table, which summarizes the result of a survey of the student body of a high school about club membership in which each student enrolled in the high school enumerated the clubs in which they were members. Q. If a student is selected at random, what is the probability that the student is either a 9th grade student or belongs to 3 or more clubs?

    The histogram above shows the distribution of 30 test scores. If test score is selected at random, what is the probability that the score falls in the interval that contains the median score?