A
B
C
D
Text Solution
Verified by Experts
The correct Answer is:


Topper's Solved these Questions
Similar Questions
Explore conceptually related problems
NARAYNA-COORDINATION COMPLEXES-EXERCISE -2
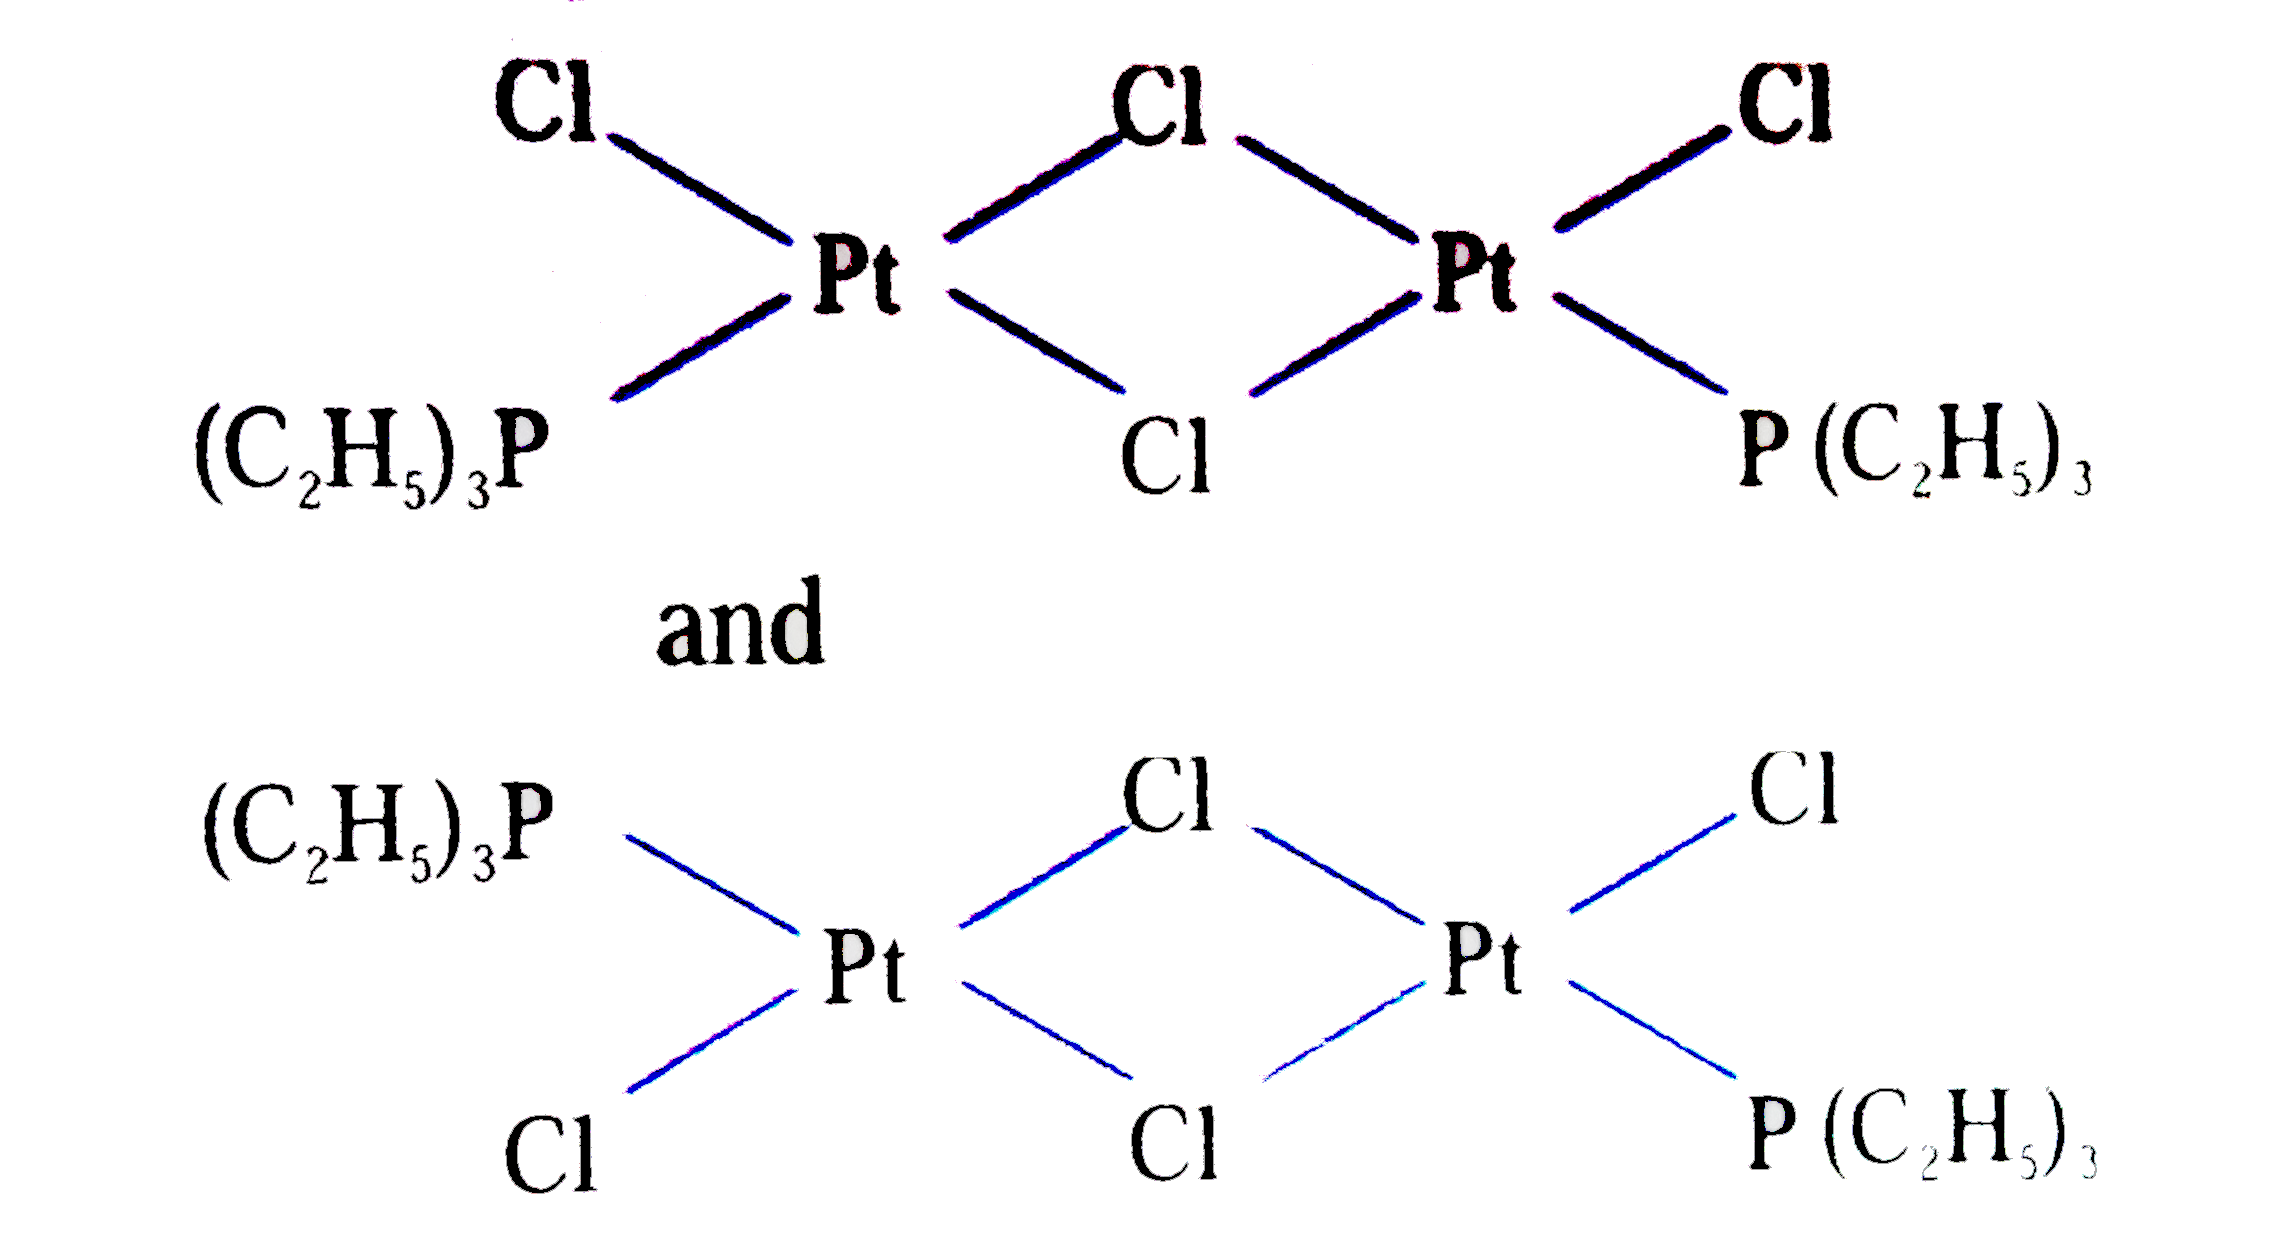
- The Complexes given below show:
Text Solution
|
- For the complex ion dichloro bis (ethylene diamine) cobalt (III), sele...
Text Solution
|
- [Pd(NH(3))(2)(SCN)(2)] and [Pd(NH(3))(2)(NCS)(2)] are :
Text Solution
|
- Which one of the following will be able to show geometrical isomerism ...
Text Solution
|
- The total number possible isomers for the complex compound [Cu^(II)(NH...
Text Solution
|
- Cis-trans isomerism is found in square planar complexes of molecular f...
Text Solution
|
- Which complex is likely to show optical activity :
Text Solution
|
- The number of bridged carbonyl groups in Mn(2)(CO)(10) is :
Text Solution
|
- The oxidation number of Co in the complex ion
Text Solution
|
- Which of the following statements is correct?
Text Solution
|
- Geometrical isomerism can be shown by
Text Solution
|
- [Co(en)3]^(3+) ion is expected to show
Text Solution
|
- The number of geometrical isomers for octahedral [CoCl(4)(NH(3))(2)]^(...
Text Solution
|
- Which of the following statements is incorrect?
Text Solution
|
- Which one of the following is an example of coordination isomerism?
Text Solution
|
- The two compounds pentaamminesulphatocobalt (III)bromide and pentaammi...
Text Solution
|
- Select the correct code about complex [Cr(NO(2))(NH(3))(5)][ZnCl(4)] :...
Text Solution
|
- Isoomerisms exhibited by [Cr(NH(3))(2)(H(2)O)(2)Cl(2)]^(+) are
Text Solution
|
- Of the following complex ions which one can form a chelate with ethyle...
Text Solution
|
- [Pt(NH(3))(NO(2))Ph(NH(2)OH)]^(+), the no. of geometrical isomers incl...
Text Solution
|