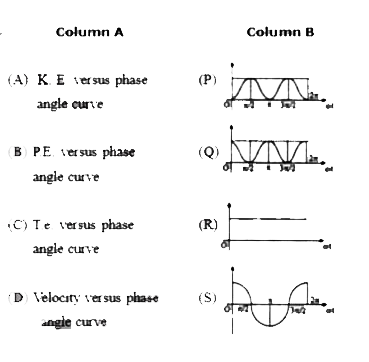
Home
Class 12
PHYSICS
The graph plotted between phase angle (p...

The graph plotted between phase angle `(phi)` and displacement of a particle from equilibrium position (y) is a sinusoidal curve as shown below. Then the best matching is

A

`A to P , B to Q, C to R , D to S`

B

`A rarrQ, B rarrP,C rarrR,DrarrS`

C

`A rarrQ, B rarrP,C rarrS,DrarrR`

D

`A rarrQ, B rarrR,C rarrS,DrarrP`

Text Solution

Verified by Experts

The correct Answer is:
B
Doubtnut Promotions Banner Mobile Dark
|

Topper's Solved these Questions

  • SIMPLE HARONIC MOTION

    MOTION|Exercise EXERCISE -2 (Leve-I I) ( SECTION - A ) (– Equation of SHM, Velocity and Acceleration in SHM, Energy of SHM)|3 Videos
  • SIMPLE HARONIC MOTION

    MOTION|Exercise EXERCISE -2 (Leve-I I) ( SECTION - B ) (Time per iod and angu lar frequency in SHM)|5 Videos
  • SIMPLE HARONIC MOTION

    MOTION|Exercise EXERCISE -2 (Leve-I) ( SECTION - G ) ( Compound pendulum / physicalpendulum, torsional pendulum )|5 Videos
  • SIMPLE HARMONIC MOTION

    MOTION|Exercise EXERCISE -3 Section - B Previous Year Problems | JEE MAIN|23 Videos
  • SOUND WAVES

    MOTION|Exercise Exercise - 3 (Section - B)|14 Videos

Similar Questions

Explore conceptually related problems

A graph between velocity and displacement of a particle performing SHM is shown. Find the acceleration when the particle is at half of maximum displacement from mean position.

The shape of graph plotted between velocity and position of a particle executing simple harmonic motion is

Knowledge Check

  • The graph plotted between phase angle (omega t) and displacement of a particle from equilibrium position (y) is a sinusoidal curve as shown below. Then the best matching is

    A
    `{:(P,Q,R,S),(1,4,3,2):}`
    B
    `{:(P,Q,R,S),(2,1,4,3):}`
    C
    `{:(P,Q,R,S),(3,2,1,4):}`
    D
    `{:(P,Q,R,S),(2,3,4,1):}`
  • The graph plotted between acceleration and displacement of a particle in SHM is

    A
    a straight line
    B
    a circle
    C
    an ellipse
    D
    a hyperbola
  • If a graph is plotted between velocity (v) and displacement (y) of a particle executing SHM from mean position, then the nature of the graph is

    A
    Straight line
    B
    Parabola
    C
    Ellipse
    D
    Hyperbola
  • Similar Questions

    Explore conceptually related problems

    The speed - time graph of a particle moving along a solid curve is shown below. The distance traversed by the particle from t = 0 to t = 3 is

    In case of a simple harmonic motion, if the velocity is plotted along the X-axis and the displacement (from the equilibrium position) is plotted along the Y-axis, the resultant curve happens to be an ellipse with ratio: ("major axis(along X)")/("major axis (along Y)")=20pi What is the frequency of the simple harmonic motion ?

    In case of a simple harmonic motion, if the velocity is plotted along the X-axis and the displacement (from the equilibrium position) is plotted along the Y-axis, the resultant curve happens to be an ellipse with the ratio =("major axis along X")/("minor axis along Y") = 20 pi What is the frequency of the simple harmonic motion?

    The figure shows a graph between velocity and displacement (from mean position) of a particle performing SHM :

    A pendulum is displaced to an angle theta from its equilibrium position, then it will pass through its mean position with a velocity v equal to