Text Solution
Verified by Experts
The correct Answer is:


Topper's Solved these Questions
HEAT-2
MOTION|Exercise EXERCISE-4 (LEVEL-I)|34 VideosHEAT-2
MOTION|Exercise EXERCISE-4 (LEVEL-II)|30 VideosHEAT-2
MOTION|Exercise EXERCISE-3 (LEVEL-I)|22 VideosHEAT TRANSFER & THERMAL EXPANSION
MOTION|Exercise Exercise - 3 Section-B|19 VideosHYDROSTATIC, FLUID MECHANICS & VISCOSITY
MOTION|Exercise EXERCISE -3 (SECTION-B) PREVIOUS YEAR PROBLEM|7 Videos
Similar Questions
Explore conceptually related problems
MOTION-HEAT-2 -EXERCISE-3 (LEVEL-II)
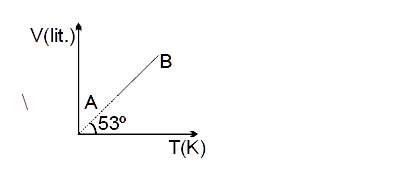
- V-T curve for 2 moles of a gas is straight line as shown in the graph ...
Text Solution
|
- An ideal gas is taken through a cyclic thermodynamic process through f...
Text Solution
|
- A carnot engine working between 300 K and 600 K has work output of 800...
Text Solution
|
- Air separated from the atmosphere by a column of mercury of length h =...
Text Solution
|
- The mass of a molecule of gas is 4 xx 10^(-30) kg. If 10^(23) molecule...
Text Solution
|
- At 10^(@)C, the value of the density of a fixed mass of an ideal gas d...
Text Solution
|
- A balloon is filled at 27^(@)C and 1 atm pressure by 500 m^(3) He. At-...
Text Solution
|
- Five grams of helium having rms speed of molecules 1000 m//s and 24 g ...
Text Solution
|
- Oxygen and hydrogen gas are at same temperature and pressure. And the ...
Text Solution
|
- One mole of an ideal diatomic gas undergoes a transition from A to B a...
Text Solution
|
- In (figure). shows two path that may be taken by a gas to go from a st...
Text Solution
|
- A sample of an ideal non linear triatomic gas has a pressure P(0) and ...
Text Solution
|
- A gas at NTP is suddenly compressed to one-fourth of its original vol...
Text Solution
|
- For the thermodynamic process shown in the figure. P (A) =1 xx 10 ^(...
Text Solution
|
- Two rectangular boxes shown in figures has a partition which can slide...
Text Solution
|