


NTA MOCK TESTS-NTA JEE MOCK TEST 29-CHEMISTRY
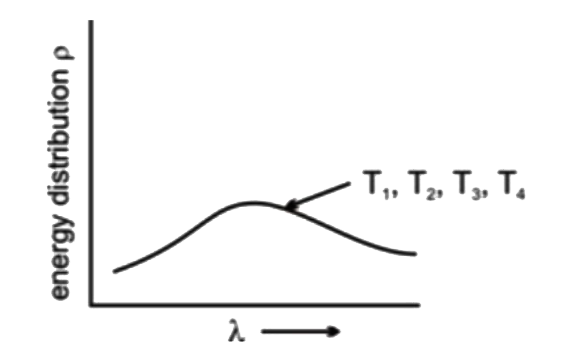
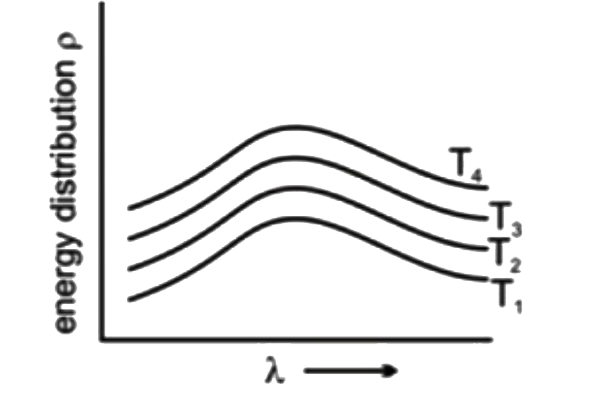
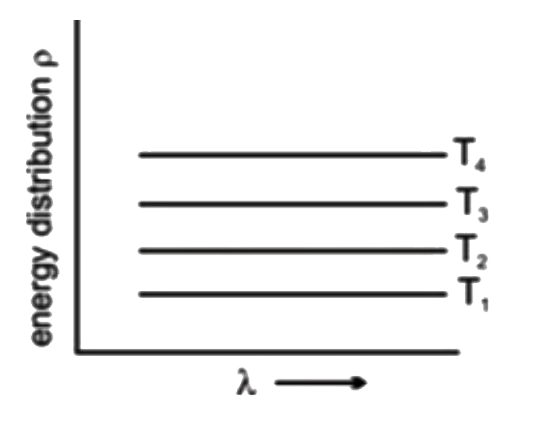
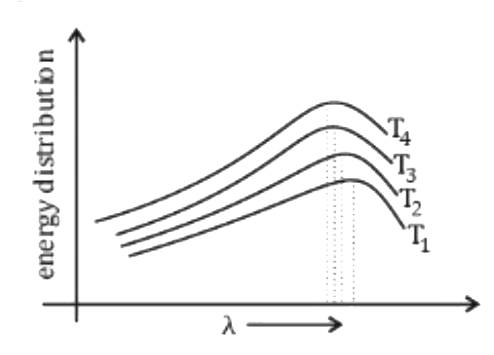
- Shown below are the black body radiation curves at temperature T(1) an...
Text Solution
|
- The complex having square planar geometry is
Text Solution
|
- The dipole moment of AX(3), BX(3)and CX(3) are 1.5 D, 0.5 D and 0 D re...
Text Solution
|
- The reation of RCONH(2) with a mixture of Br(2) and aqueous KOH gives ...
Text Solution
|
- Sulphide ores are common for the metals
Text Solution
|
- Bleaching powder contains a salt of an oxoacid as one of its component...
Text Solution
|
- Which of the following statements is correct for a lyophilic sol?
Text Solution
|
- Reduction potentials of four elements P, Q, R, S is -2.90V, 0.34V, 1.2...
Text Solution
|
- One mole of 4 - nitrocatechol (4 -nitro - 1, 2 - dihydroxybenene) on t...
Text Solution
|
- The colour change of an indicator Hln in acid base titrations is given...
Text Solution
|
- When the concentration of nucleophile is reduced to half, the rate of ...
Text Solution
|
- Which of the following is correct?
Text Solution
|
- Nitrogen exists as diatomic molecule and phosphorus as P(4). Why ?
Text Solution
|
- Three samples of 100 g of water (samples I, II and III), initially kep...
Text Solution
|
- IUPAC name of the compound
Text Solution
|
- When a metal is electroplated with silver (Ag)
Text Solution
|
- Which of the following amino acid is basic in nature ?
Text Solution
|
- Iodine is a solid and sublimes at ordinary temperature.This is because...
Text Solution
|
- The equilibrium constant of the following isomerisation reaction at 40...
Text Solution
|
- Which of the following statements regarding boric acid is false?
Text Solution
|