Text Solution
Verified by Experts
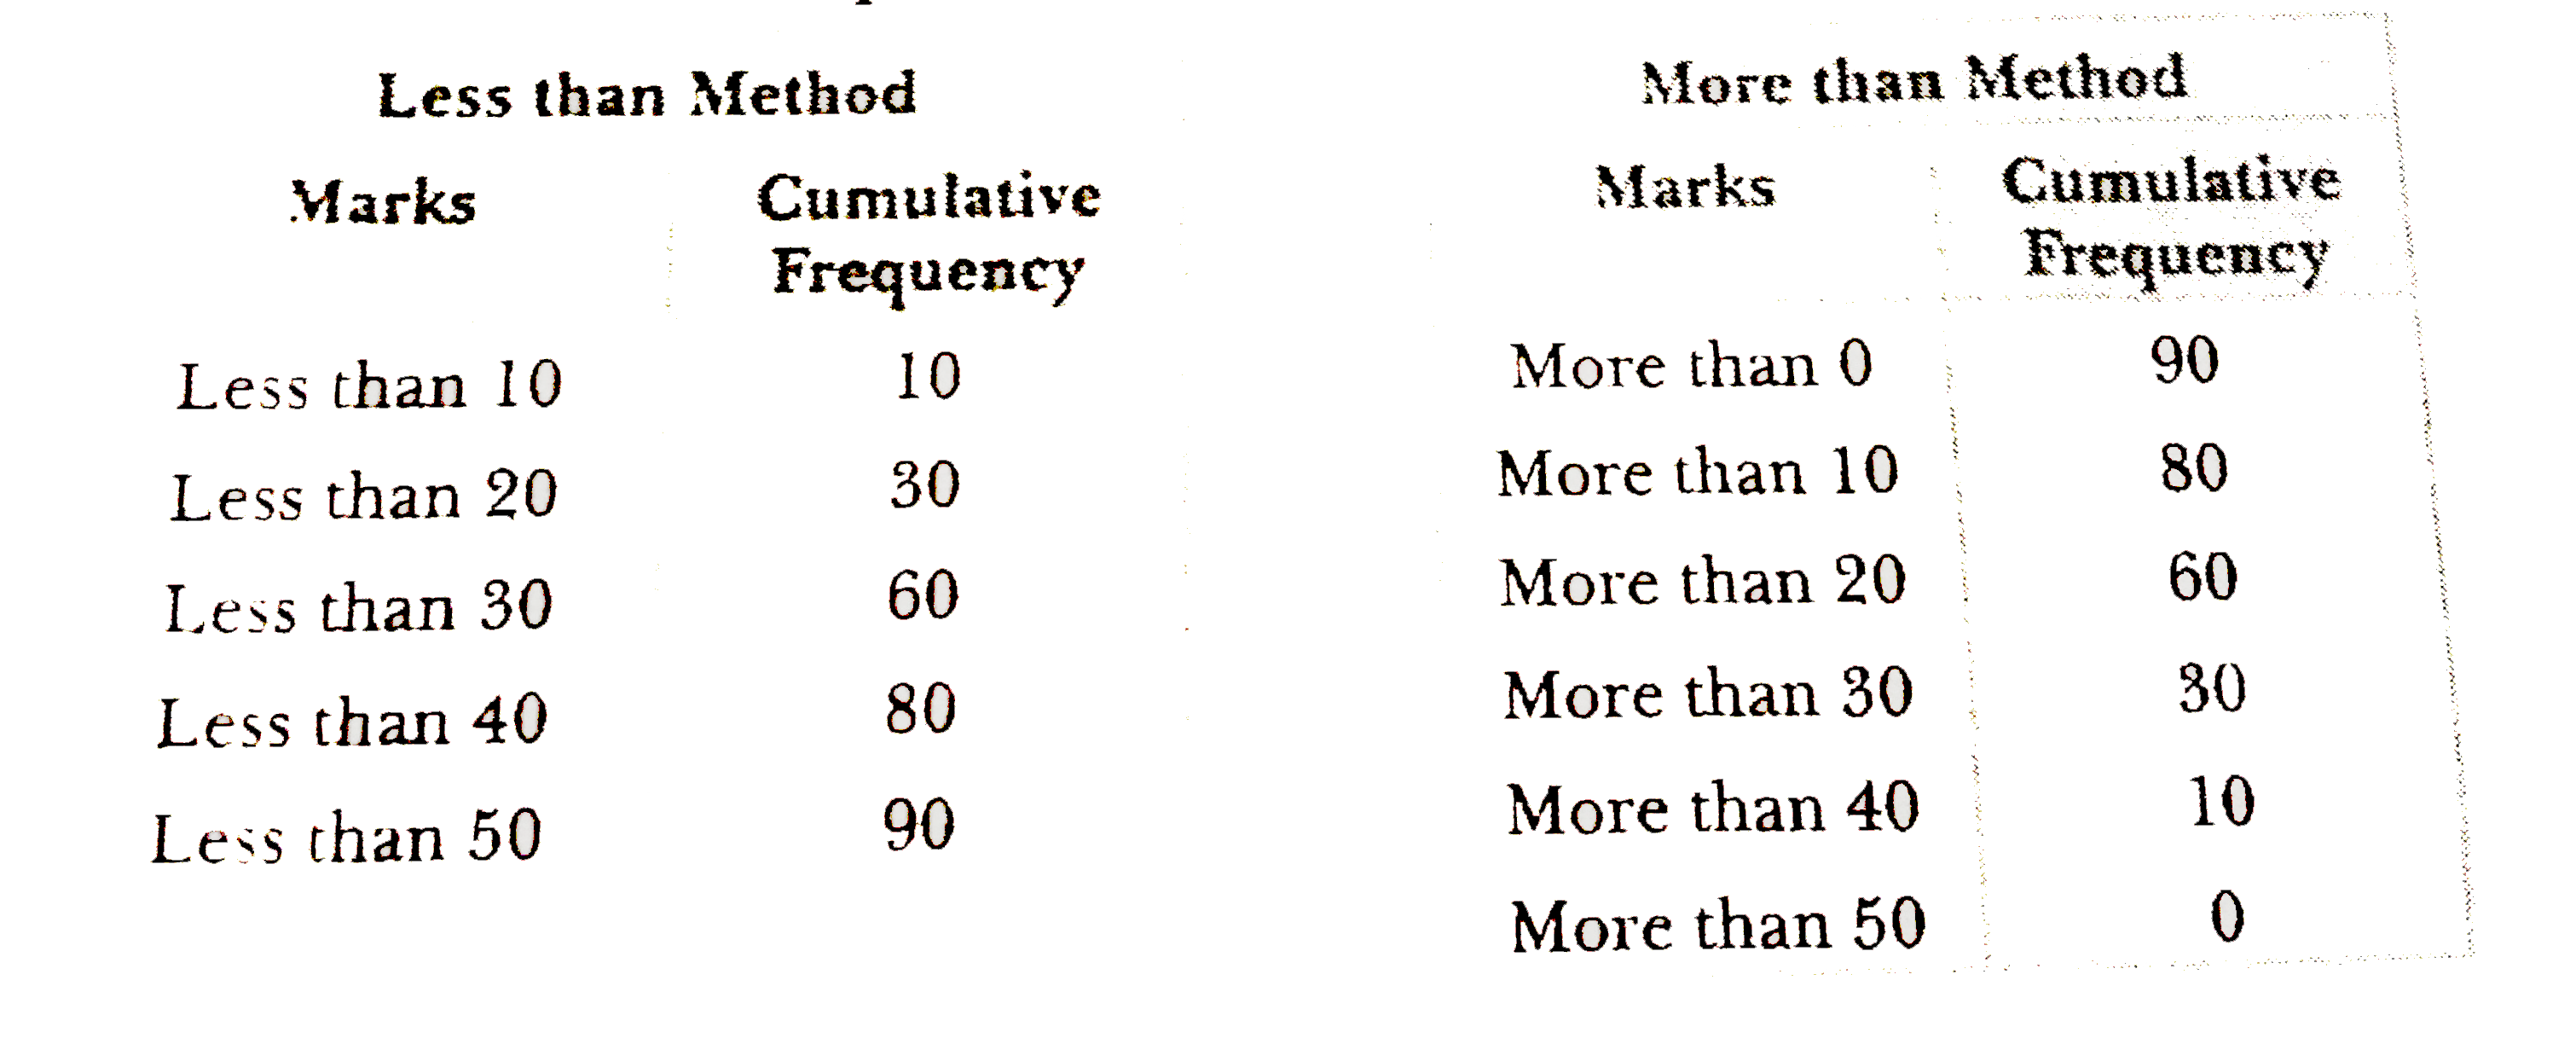
 <br> M= Size of ``((N)/(2))` th item <br> = Size of `((90)/(2))` th item <br> = SIize of 45 th item <br> It lies in the class interval 20-30. <br> Method II: By making use of both the ogive curves together , the median is computed graphically as follows : <br> `( ## TRJ_ECO_XI_C01_S01_050_S03.png)


Topper's Solved these Questions
MEASURES OF CENTRAL TENDENCY MEDIAN AND MODE
TARUN JAIN & VK OHRI|Exercise Objective Type Questios|26 VideosMEASURES OF CENTRAL TENDENCY MEDIAN AND MODE
TARUN JAIN & VK OHRI|Exercise Concept - based Objective Questions|7 VideosMEASURES OF CENTRAL TENDENCY MEDIAN AND MODE
TARUN JAIN & VK OHRI|Exercise NCERT Questions (With Hints to Answers)|5 VideosMEASURES OF CENTRAL TENDENCY - ARITHMETIC MEAN
TARUN JAIN & VK OHRI|Exercise Illustration|72 VideosMEASURES OF DISPERSION
TARUN JAIN & VK OHRI|Exercise Learning by doing|30 Videos
TARUN JAIN & VK OHRI-MEASURES OF CENTRAL TENDENCY MEDIAN AND MODE-Miscellaneous Illustrations
- Caculate Q(1),Q(3),D(9)andP(70) from the following data : {:(120...
Text Solution
|
- Calculate median , quartiles , 6th decile and 70 th percentile from th...
Text Solution
|
- Following is the distribution of marks in Economics obtained by 50 stu...
Text Solution
|
- Find the mode from the following data : 8,10,5,8,12,7,8,9,11,7
Text Solution
|
- From the following data , determine the mode by grouping method : ...
Text Solution
|
- Caculate the mode from the following data : {:("Wages (Rs.)",0-5...
Text Solution
|
- Calculate the mode from the following data : {:("Class Interval"...
Text Solution
|
- The mode and mean are 26.6 and 28.1 respectively in an asymmetrical di...
Text Solution
|
- Calculate the median of the following items : 15,23,20,20,23,35,...
Text Solution
|
- Find out median marks from the following data : {:("Marks",0-10,1...
Text Solution
|
- Following is the distribution of marks in Statistics obtained by 32 st...
Text Solution
|
- Find the missing frequency of the group 20-30 when the median is 24. ...
Text Solution
|
- Locate the median graphically from the following data : {:("Marks...
Text Solution
|
- Calculate Q(1),Q(3),D(7)and P(89) from the following data : {:(...
Text Solution
|
- The marks obtained by 100 students of a school are given below. ...
Text Solution
|
- Find the mode from the following data : 5,8,4,5,5,8,4,7,8,5
Text Solution
|
- Calculate mode from the following data : {:("Class Interval",30-4...
Text Solution
|
- Calculate mean in an asymmetrical distribution if mode is 16 and medi...
Text Solution
|
- The arithmetic mean , the mode and the median of a group of 75 observa...
Text Solution
|
- Calculate mean , median and mode from the following data : {:("Cl...
Text Solution
|