A
B
C
D
Text Solution
Verified by Experts
The correct Answer is:
Topper's Solved these Questions
Similar Questions
Explore conceptually related problems
ARIHANT SSC-MIXED GRAPH-Higher Skill Level Questions
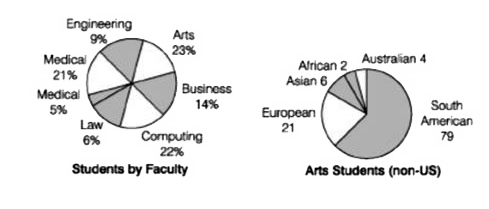
- Directions (Q. Nos. 1-5) The pie charts below show the percentage of s...
Text Solution
|
- Directions (Q. Nos. 1-5) The pie charts below show the percentage of s...
Text Solution
|
- Directions (Q. Nos. 1-5) The pie charts below show the percentage of s...
Text Solution
|
- Directions (Q. Nos. 1-5) The pie charts below show the percentage of s...
Text Solution
|
- Directions (Q. Nos. 1-5) The pie charts below show the percentage of s...
Text Solution
|
- Directions (Q. Nos. 6-10) Items Study the two figures given below and ...
Text Solution
|
- Directions (Q. Nos. 6-10) Items Study the two figures given below and ...
Text Solution
|
- Directions (Q. Nos. 6-10) Items Study the two figures given below and ...
Text Solution
|
- Directions (Q. Nos. 6-10) Items Study the two figures given below and ...
Text Solution
|
- Directions (Q. Nos. 6-10) Items Study the two figures given below and ...
Text Solution
|
- Directions (Q. Nos. 11-15) Study the radar graph carefully and answer ...
Text Solution
|
- Directions (Q. Nos. 11-15) Study the radar graph carefully and answer ...
Text Solution
|
- Directions (Q. Nos. 11-15) Study the radar graph carefully and answer ...
Text Solution
|
- Directions (Q. Nos. 11-15) Study the radar graph carefully and answer ...
Text Solution
|
- In which year was the difference between the number of students in uni...
Text Solution
|
