Text Solution
Verified by Experts


Similar Questions
Explore conceptually related problems
Recommended Questions
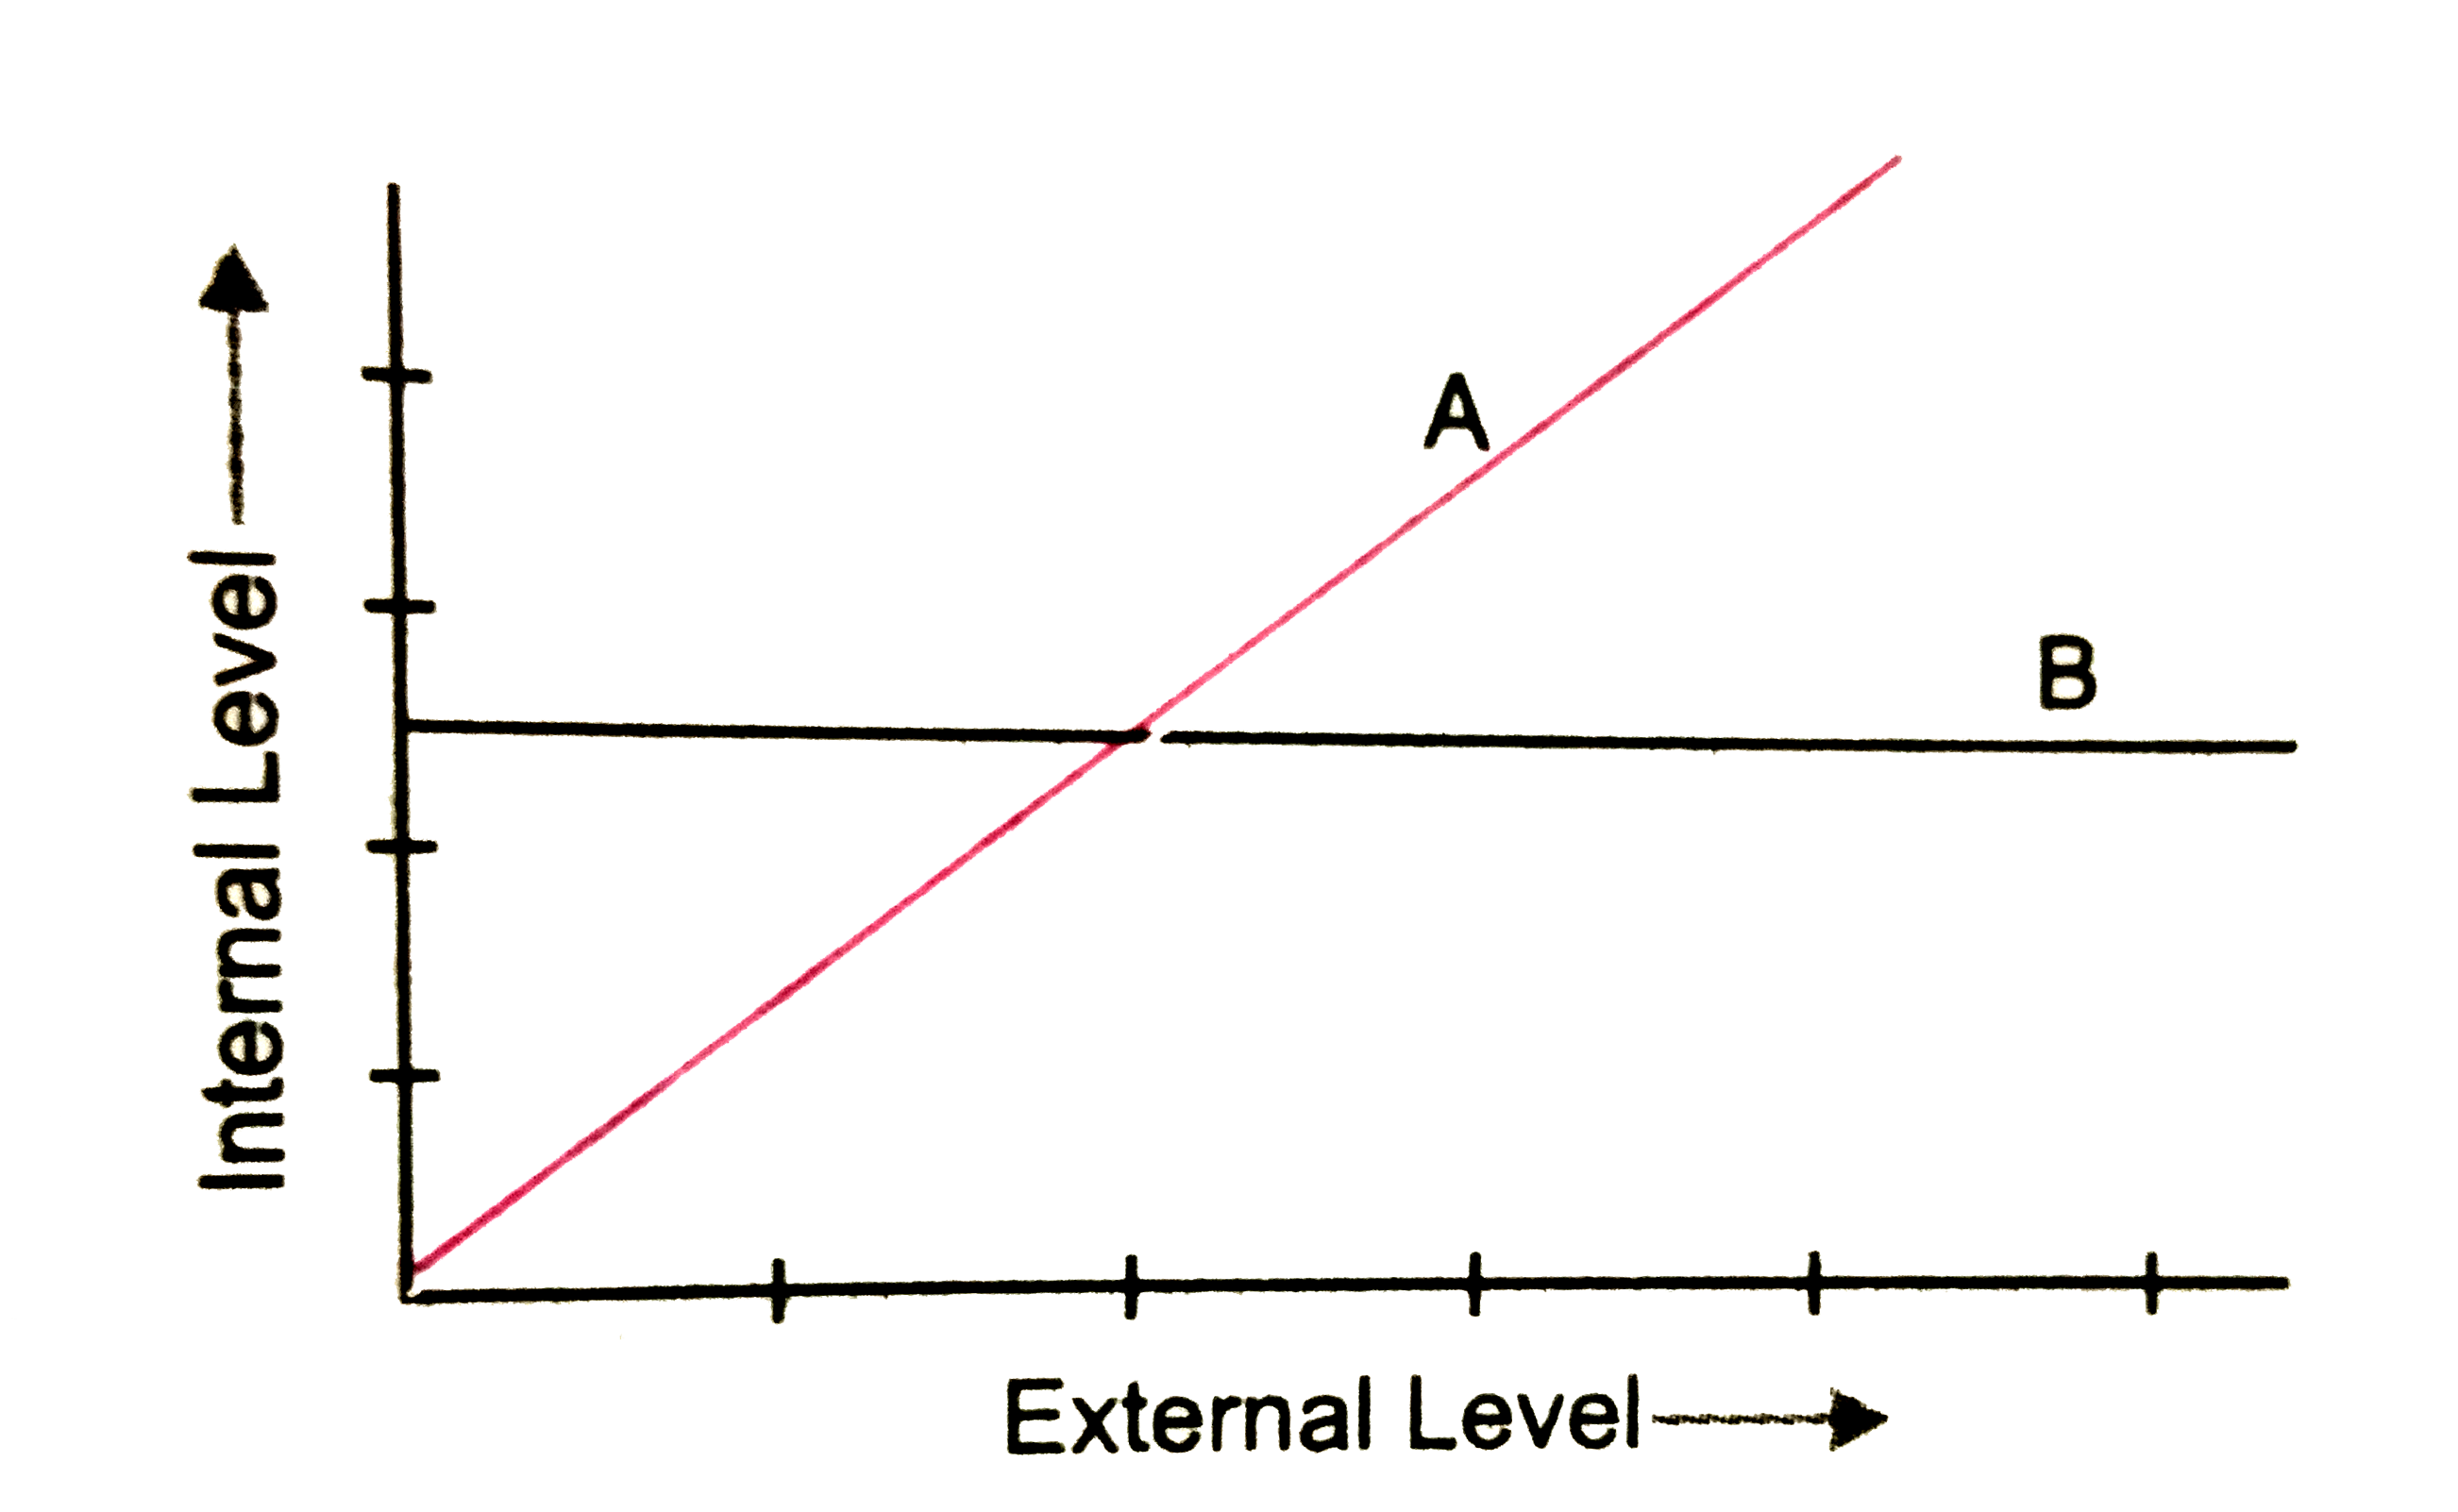
- The graph given below represents the organisms reponse to temperature ...
Text Solution
|
- The graph given below represents changes in different ecological param...
Text Solution
|
- (a) The graph given below represents the organisms response to tempera...
Text Solution
|
- The graph given below represents the organisms reponse to temperature ...
Text Solution
|
- Which of the following inequalities represents the graph shown below o...
Text Solution
|
- Which of the following graphs represent the function of x ? Why
Text Solution
|
- a. What does the graph represent ? b.What is the importance of this gr...
Text Solution
|
- (a) The graph given below represents the organisms response to temper...
Text Solution
|
- The graph given below represents changes in different ecological param...
Text Solution
|