Home
Class 12
PHYSICS
The acceleration-time graph of a particl...

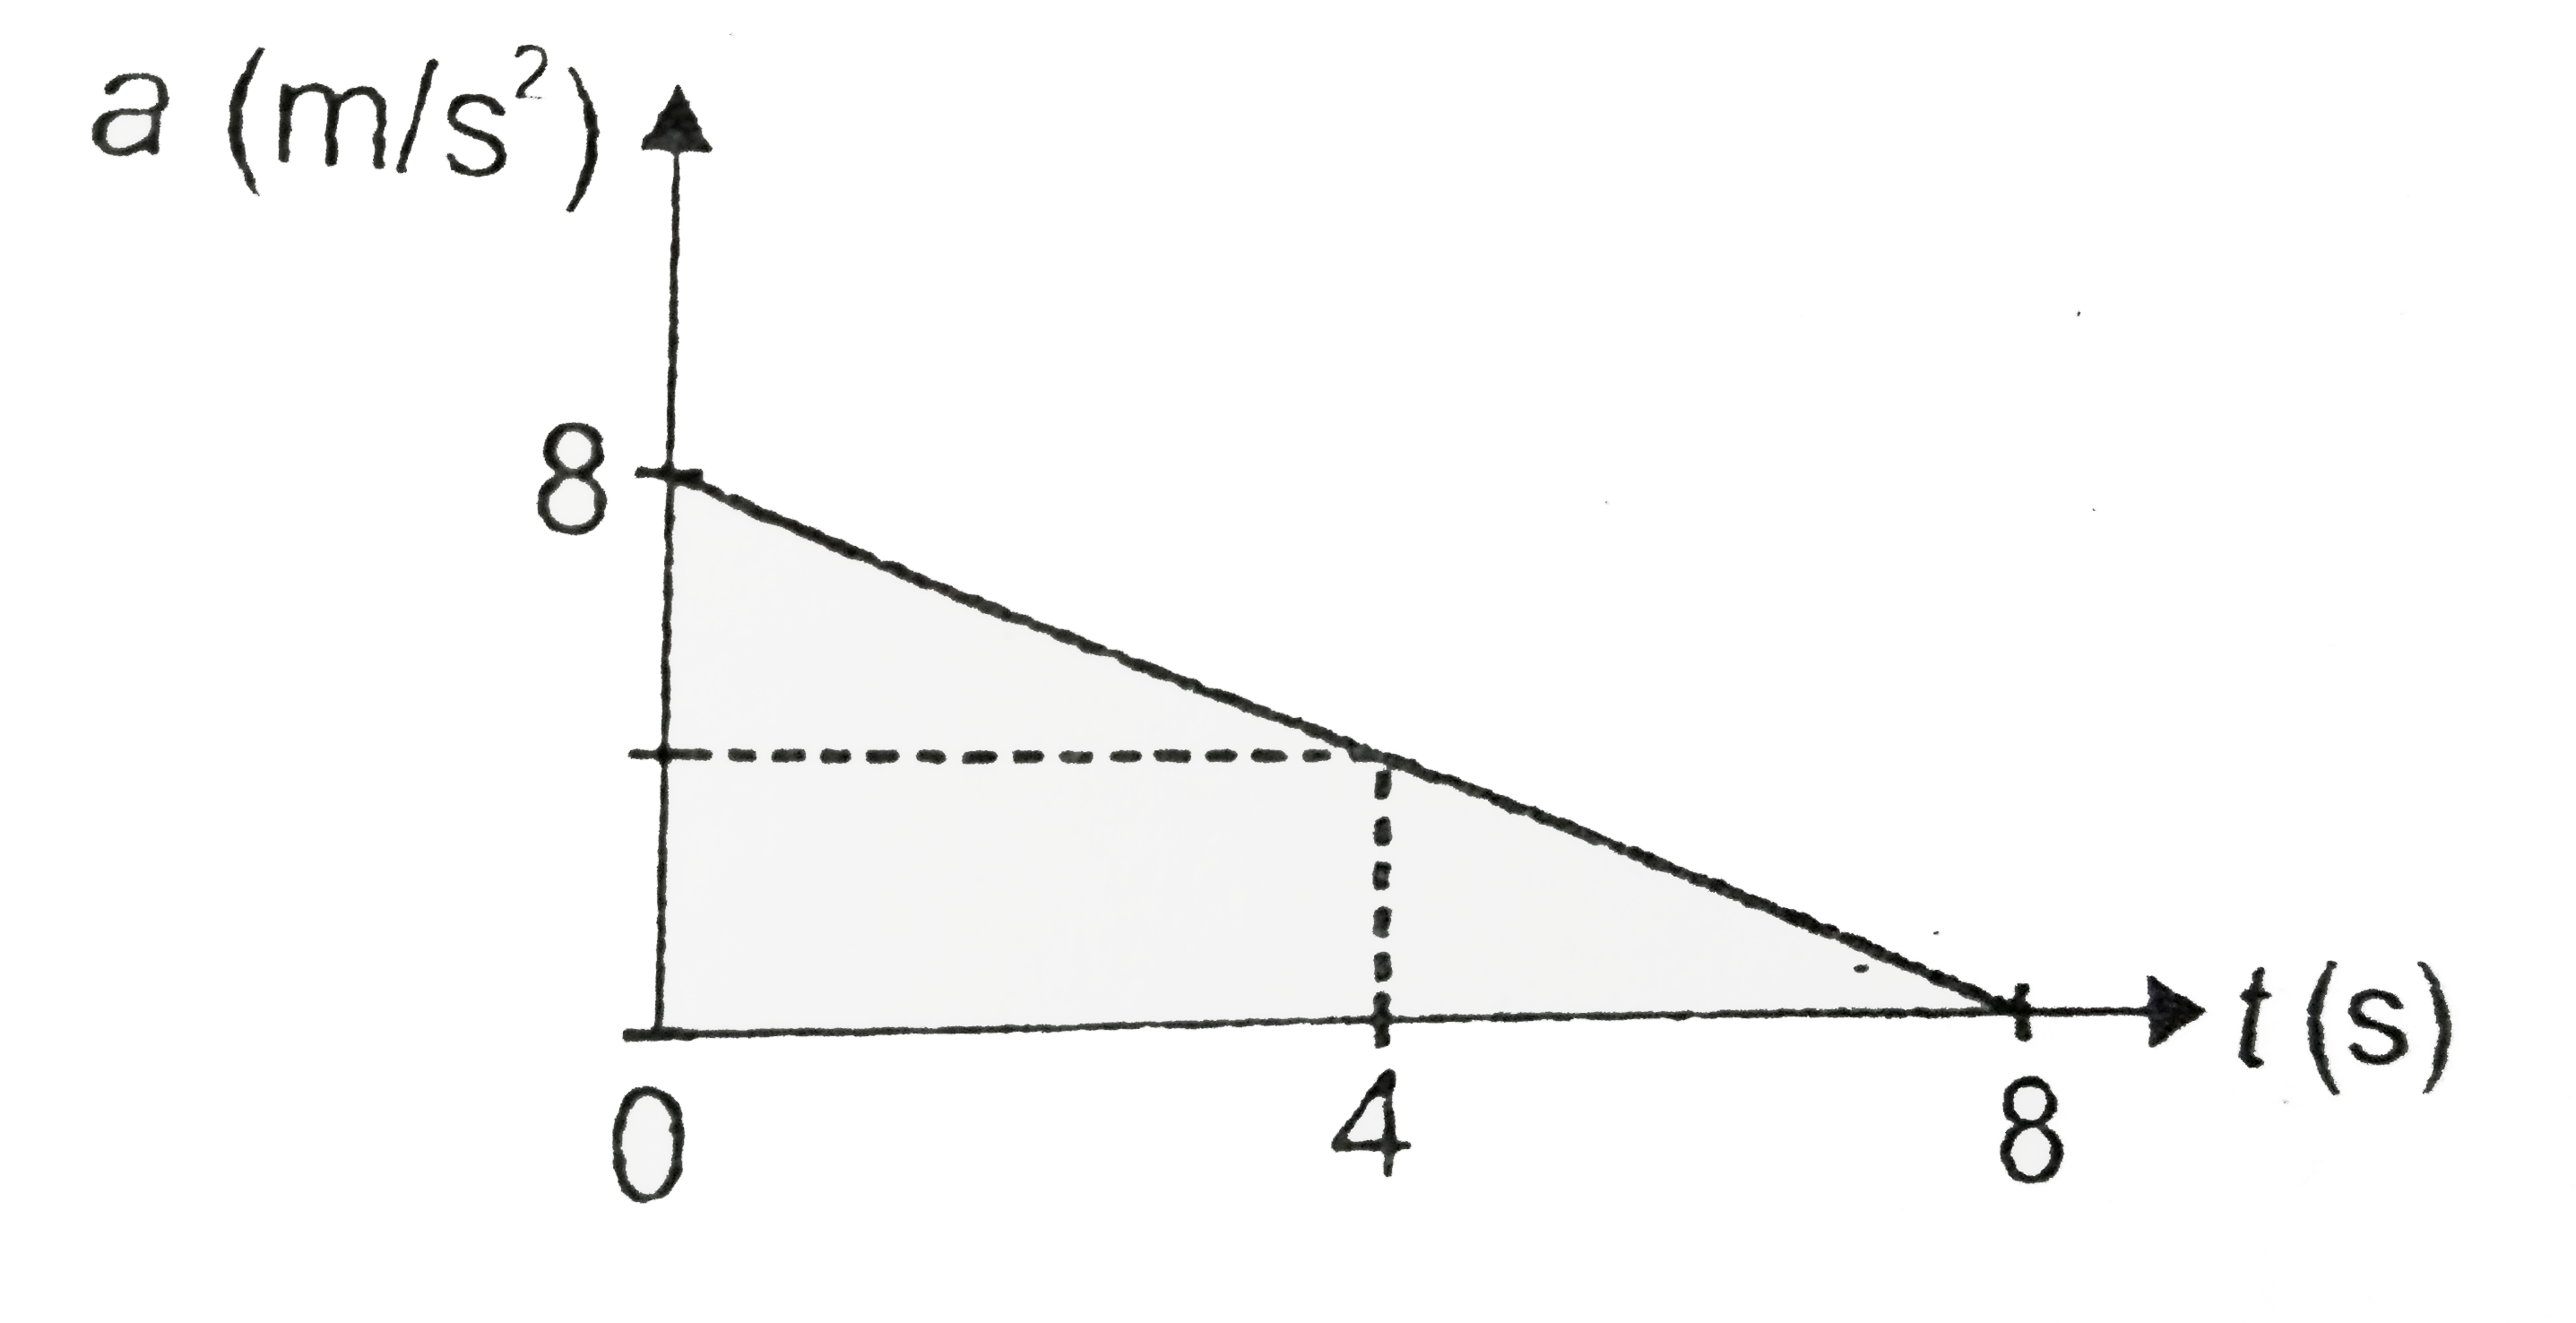
The acceleration-time graph of a particle moving along x-axis is shown in the figure. If the particle starts with velocity 3 m/s at t = 0, find the velocity of particle at t = 4 s.

Text Solution

Verified by Experts

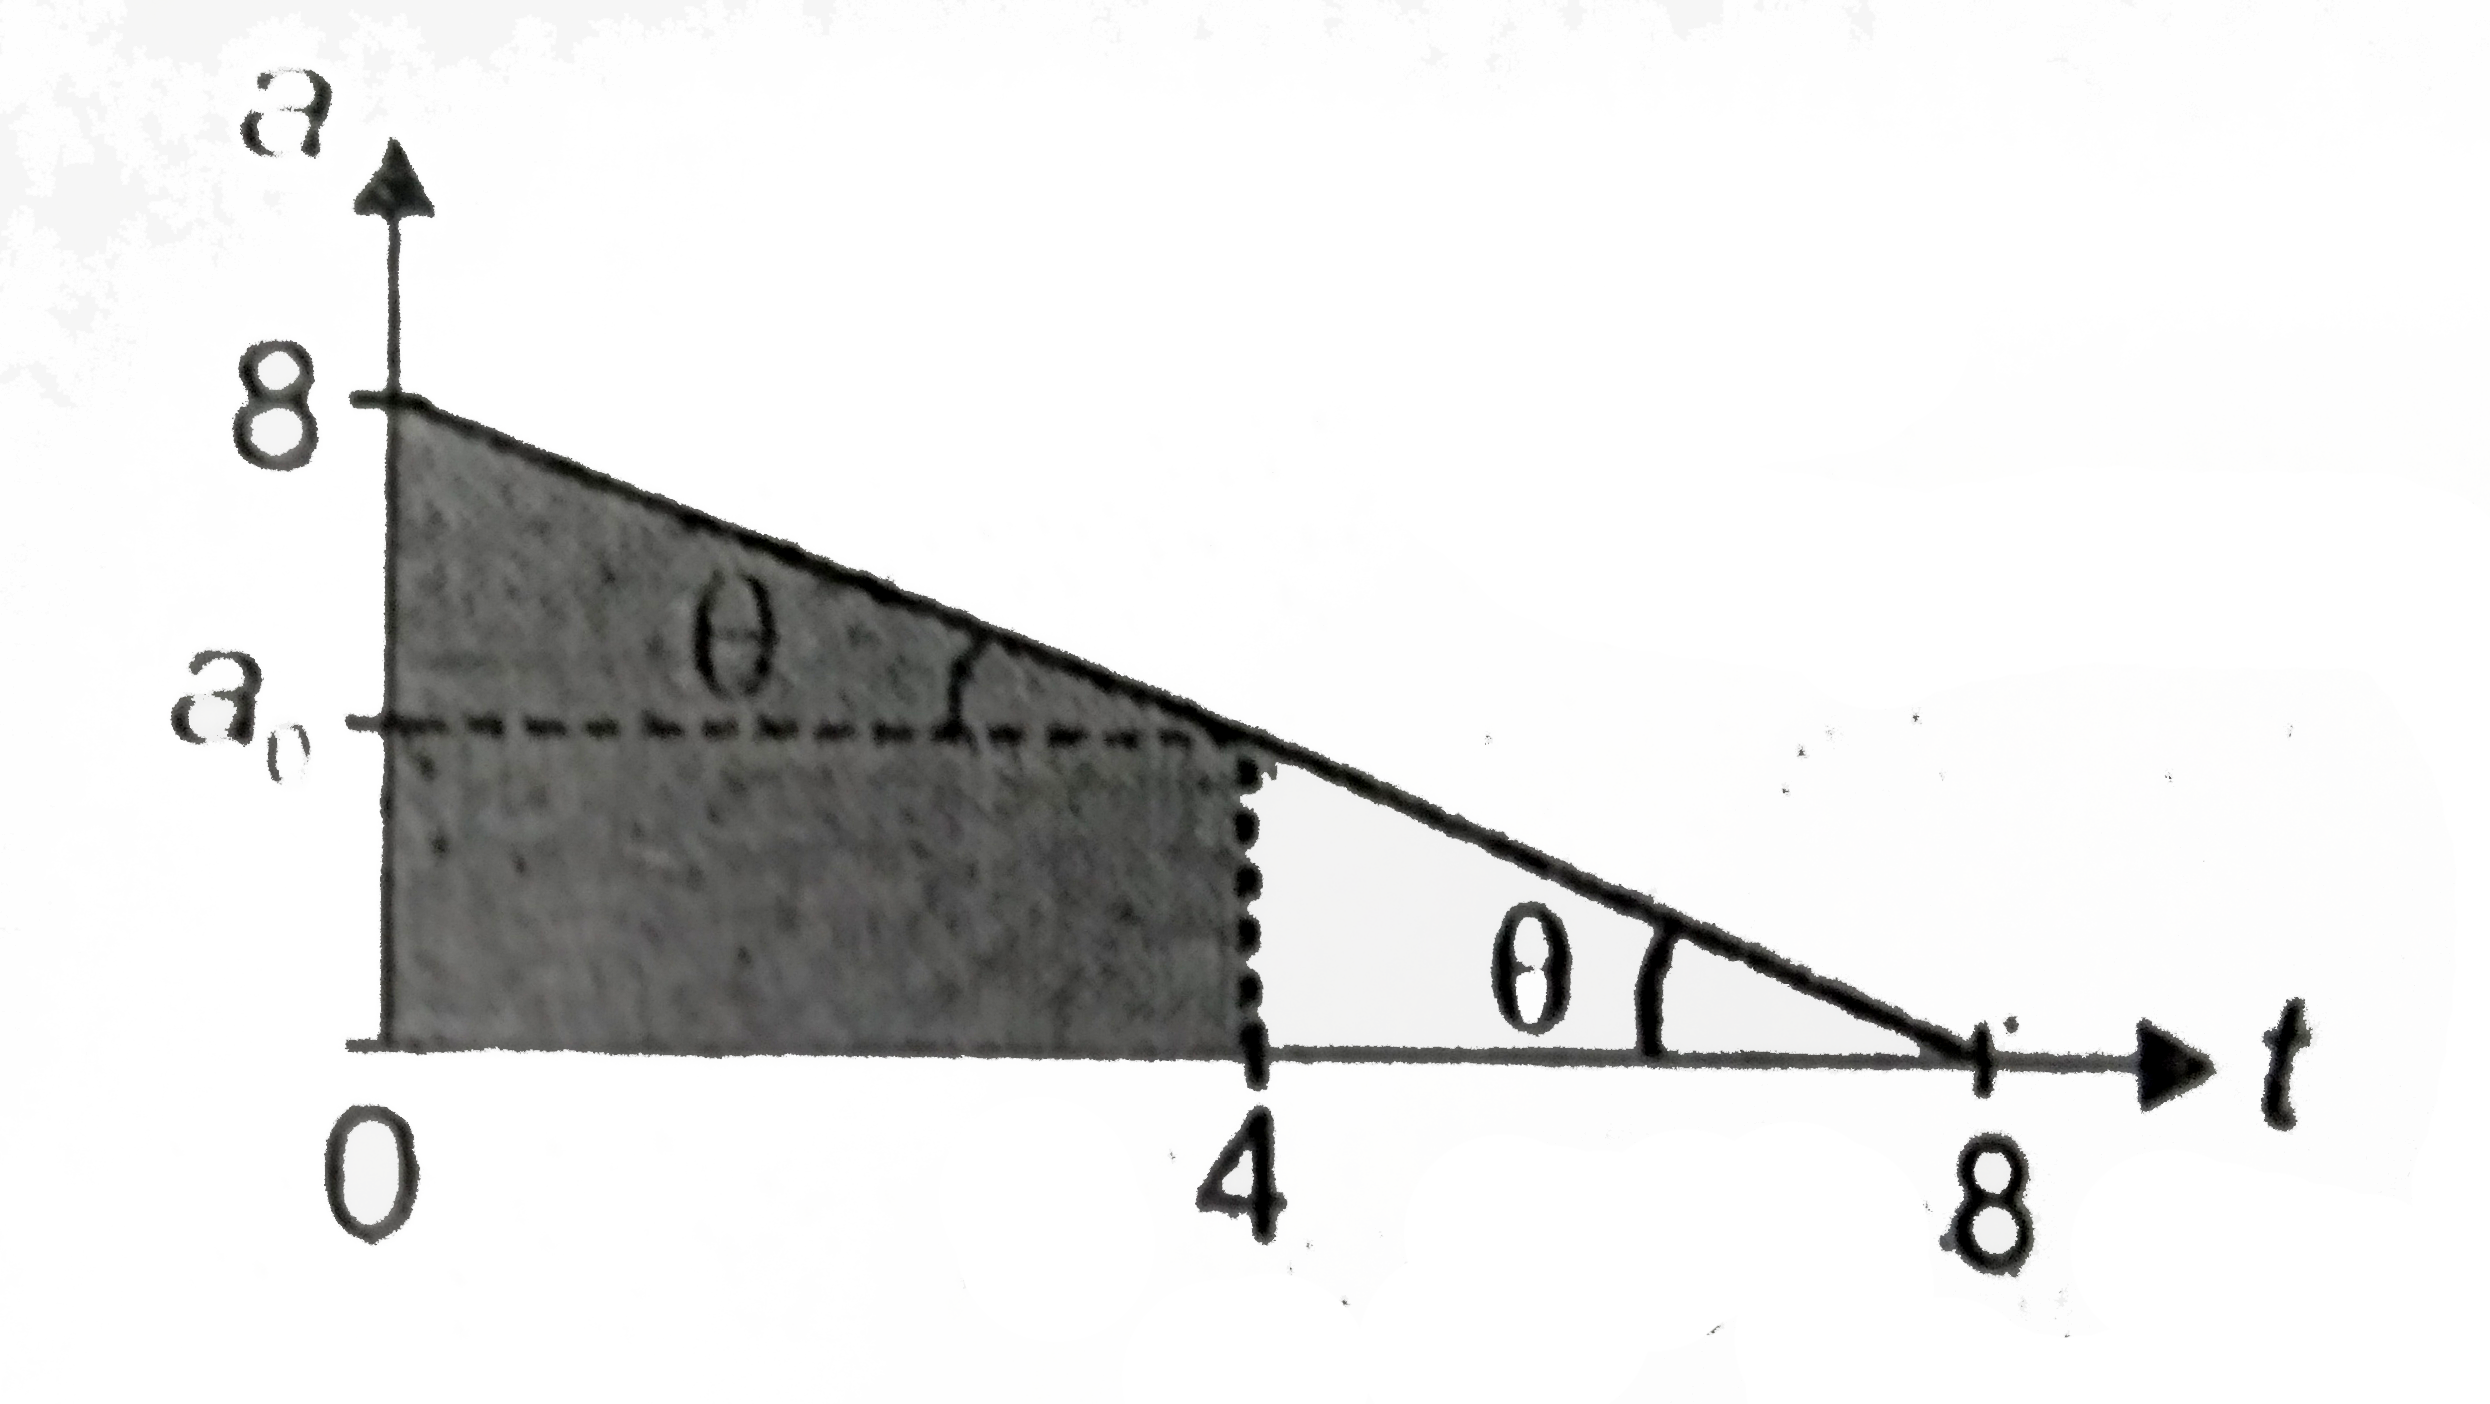
The velocity at t = 4 s will depend on the change in velocity of the particle in the interval 0 to 4 s which is given by the area under a-t graph. Before calculating area let us find the acceleration at t = 4 s.
`tantheta=(8-a_(0))/(4)=(8)/(8)" (by the graph)"`
`rArr" "a_(0)=4m//s^(2)`
`"Change in velocity "="Area between 0 to 4 s"`
`=(1)/(2)xx(4+8)xx4=24m//s`
`rArr" final velocity (v)"-"initial velocity (u) = 24"`
`rArr" "v=u+24=3+24=27m//s`
Doubtnut Promotions Banner Mobile Dark
|

Topper's Solved these Questions

  • MOTION IN STRAIGHT LINE

    AAKASH INSTITUTE|Exercise Try Yourself|40 Videos
  • MOTION IN STRAIGHT LINE

    AAKASH INSTITUTE|Exercise Assignment (SECTION - A)|50 Videos
  • MOTION IN A STRAIGHT LINE

    AAKASH INSTITUTE|Exercise ASSIGNMENT (SECTION - D)|15 Videos
  • MOVING CHARGE AND MAGNESIUM

    AAKASH INSTITUTE|Exercise SECTION D|16 Videos

Similar Questions

Explore conceptually related problems
The acceleration time graph of a particle moving along a straight line is as shown. The time at which the particle will have the velocity same as initial velocity (in s) is?

The acceleration of a particle varies with time t as a=t^(2)+t+2 where t is in seconds. The particle starts with an initial velocity v-3m/s at t=0. find the velocity of the particle at the end of 5s.

Knowledge Check

  • The acceleration - time graph for a particle moving along x - axis is shown in figure, If the initial velocity of particle is -5m//s , the velocity at t = 8 s is

    A
    `+15m//s`
    B
    `+20m//s`
    C
    `-15m//s`
    D
    `-20m//s`
  • The acceleration time graph of a particle is shown in the figure-1.140. What is the velocity of particle at t=8s, if initial velocity of particle is 3 m/s? (Assume motion is 1 dimension) :

    A
    4 m/s
    B
    5 m/s
    C
    6 m/s
    D
    7 m/s
  • The acceleration-time graph of a particle moving in a straight line is as shown in figure. The velocity of the particle at time t = 0 is 2 m//s . The velocity after 2 seconds will be

    A
    `6 m//s`
    B
    `4 m//s`
    C
    `2 m//s`
    D
    `8 m//s`
  • Similar Questions

    Explore conceptually related problems
    The position (X)-time (t) graph for a particle of mass 1 kg moving along x-axis is shown in figure. Find impulse on particle at t = 4 s.

    The acceleration-displacement graph of a particle moving in a straight line is as shown in figure, initial velocity of particle is zero. Find the velocity of the particle when displacement of the particle is s=12 m .

    The x-t graph of a particle moving along a straight line is shown in figure The a-t graph of the particle is correctly shown by

    The x-t graph of particle moving along a straight line is shown in figure The v-t graph of the particles is correctly shown by

    The x-t graph of a particle moving along a straight line is shown in figure The v-t graph of the particle is correctly shown by