A
B
C
D
Text Solution
Verified by Experts
The correct Answer is:


Topper's Solved these Questions
Similar Questions
Explore conceptually related problems
HC VERMA-NEWTON'S LAWS OF MOTION-Objective 2
- A refrence frame attached to the earth
Text Solution
|
- A particle stays at rest as seen in a frame. We can concude that :
Text Solution
|
- A particle is found to be at rest when seen from a frame S(1) and movi...
Text Solution
|
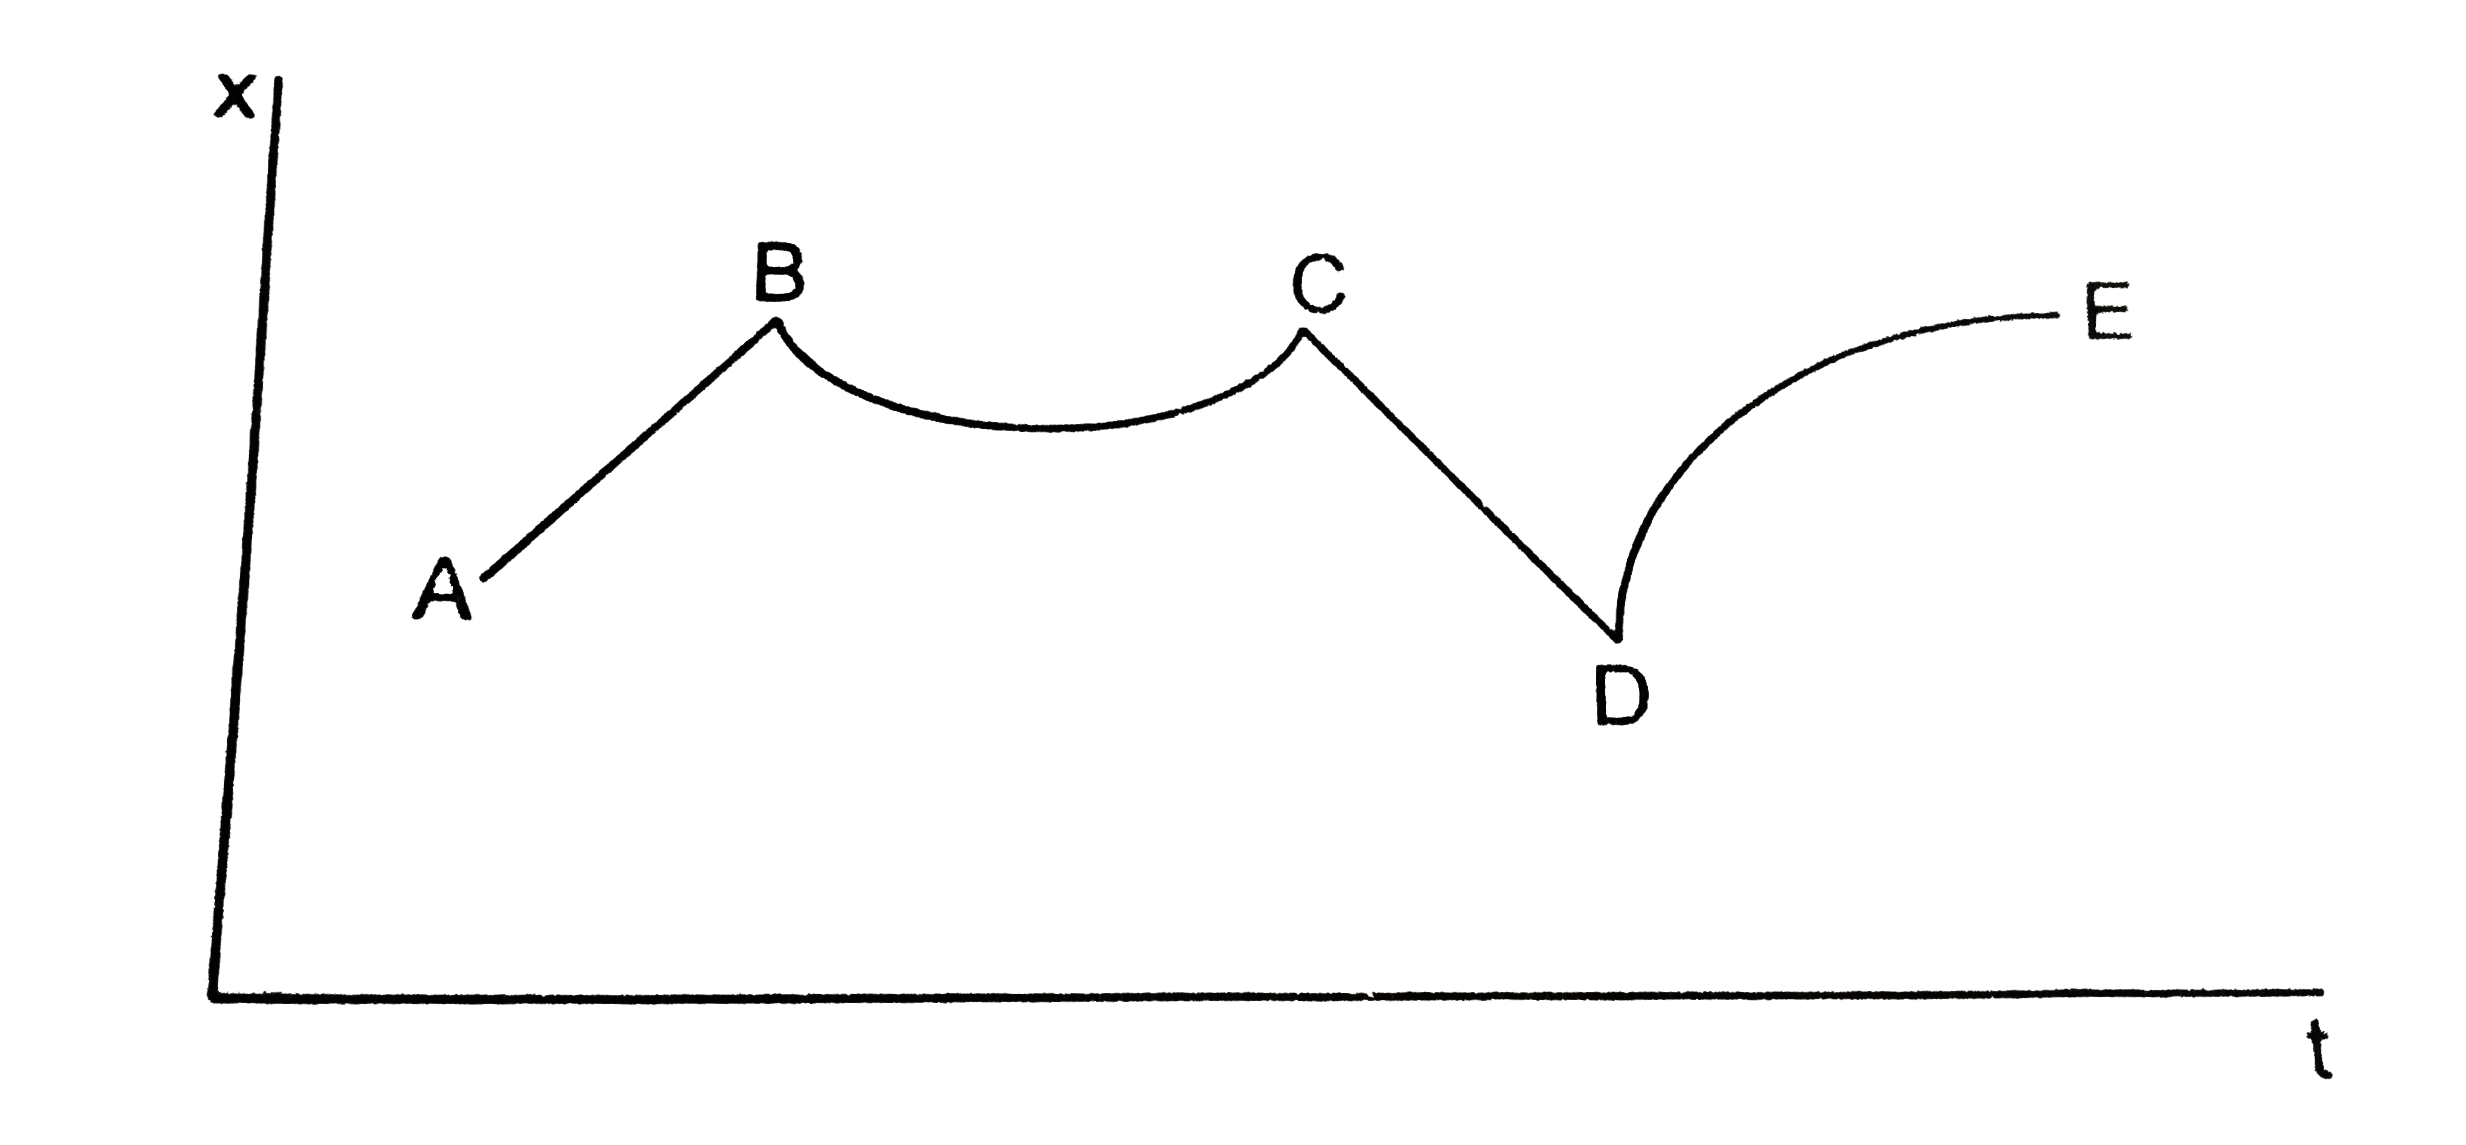
- Figure shows the displacement of a particle going along the X-axis as ...
Text Solution
|
- Figure shows a heavy block kept on a frictionless surface and being pu...
Text Solution
|
- The force exerted by the floor of an elevator on the foot of a person ...
Text Solution
|
- If the tension in the cable supporting an elevator is equal to the wei...
Text Solution
|
- A particle is observed from two frames S(1) and S(2). The frame S(2) m...
Text Solution
|
- A person says that he mesured the acceleration of a particle to be non...
Text Solution
|