Home
Class 11
CHEMISTRY
A plot of volume (V) versus temperature ...

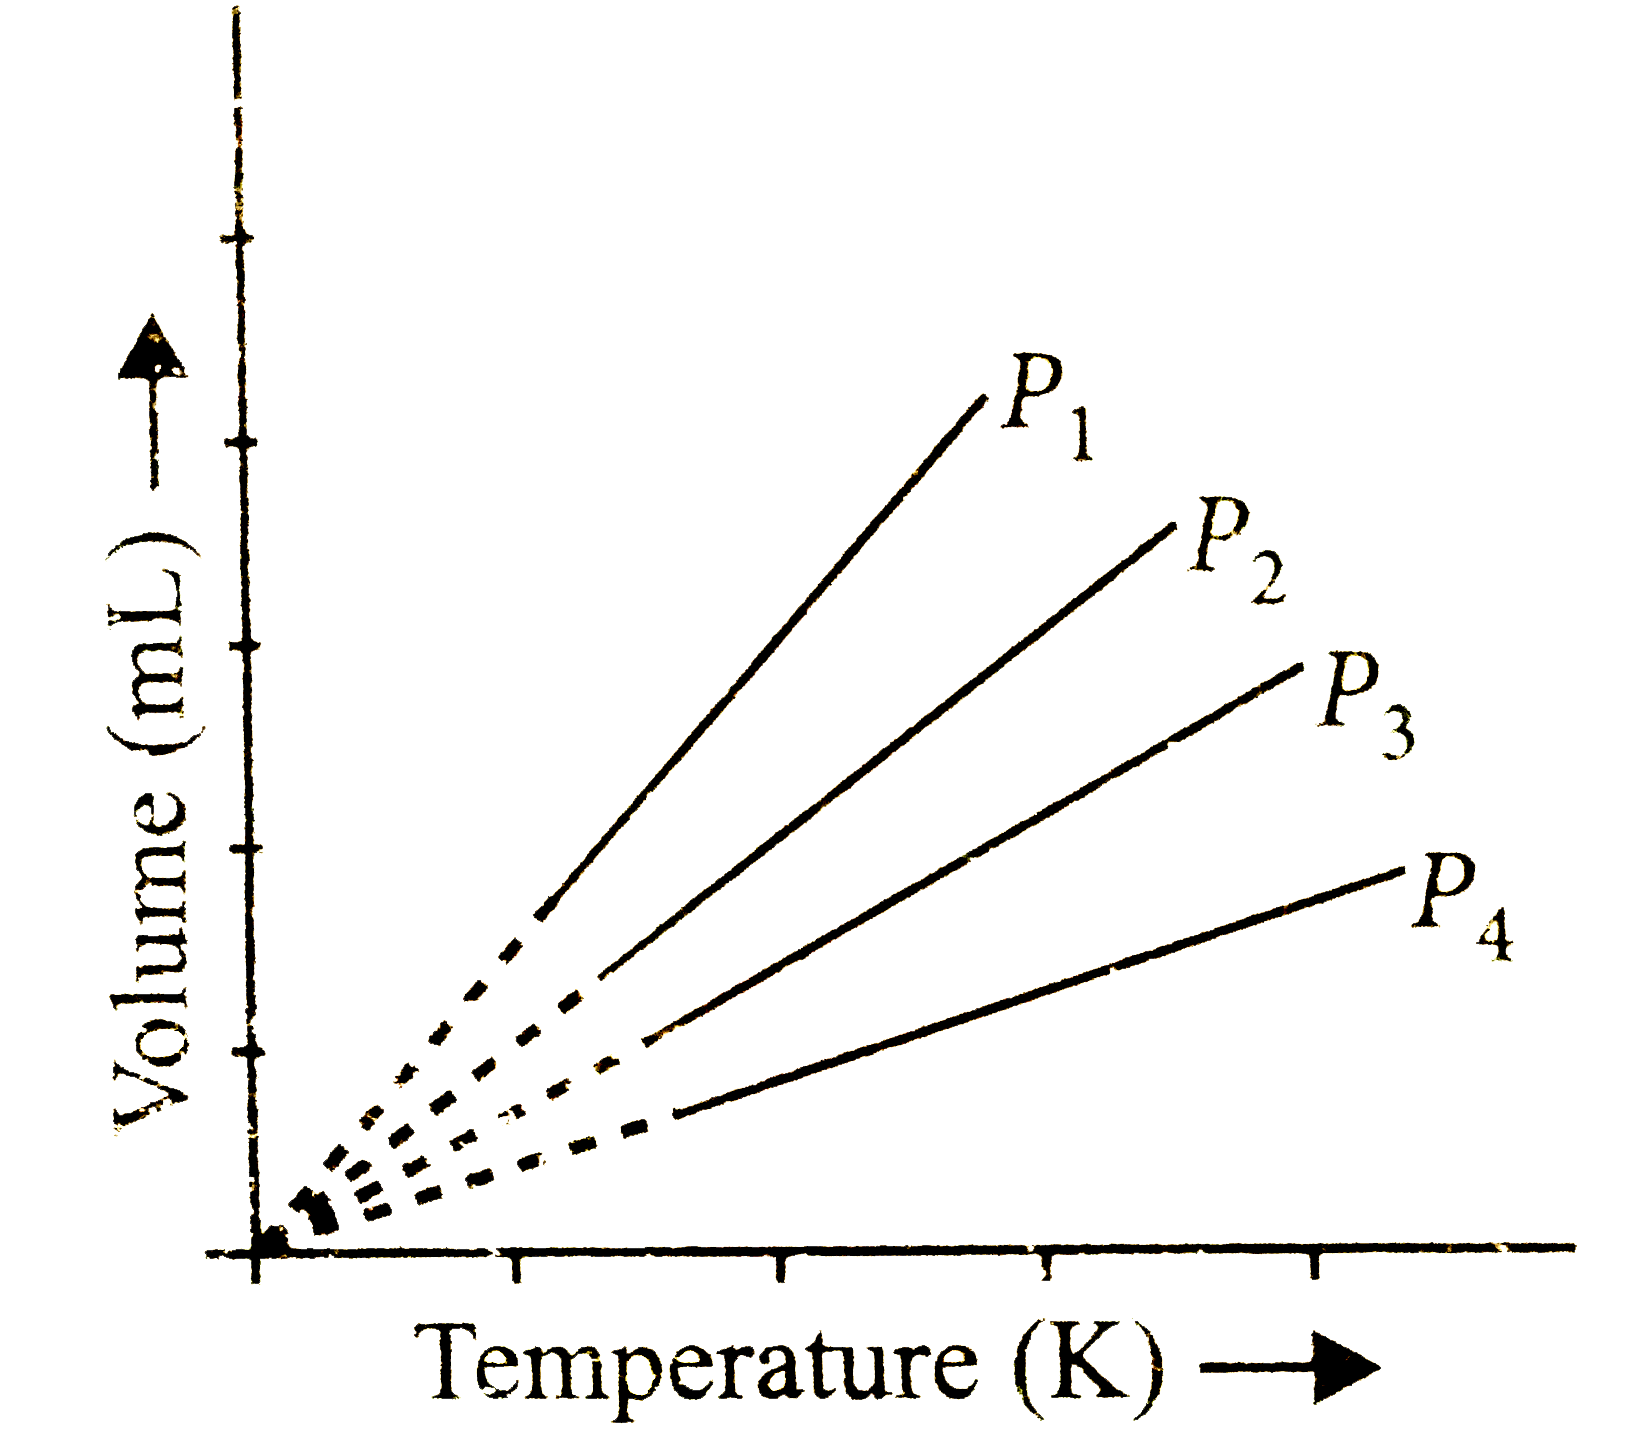
A plot of volume (V) versus temperature (T) for a gas at constant pressure is a straight line passing through the origin . The plots at different values of pressure are shown in figure .
Which of the following order of pressure is correct for this gas ?

A

`P_(1)gt P_(2)gt P_(3)gt P_(4)`

B

`P_(1)=P_(2)P_(2)=P_(3)=P_(4)`

C

`P_(1)lt P_(2)lt P_(3)lt P_(4)`

D

`P_(1)lt P_(2)=P_(3)lt P_(4)`

Text Solution

Verified by Experts

The correct Answer is:
C

PV = constant at gives temperature
`therefore P_(1)V_(1)=P_(2)V_(2)=P_(3)V_(3)=P_(4)V_(4)`
Now, `V_(1)gt V_(2)gt V_(3)gt V_(4) " "` (From the figure)
Hence, `P_(1)lt P_(2)lt P_(3) lt P_(4) " " (because P prop (1)/(V))`
Doubtnut Promotions Banner Mobile Dark
|

Topper's Solved these Questions

  • STATES OF MATTER

    NCERT FINGERTIPS|Exercise Assertion And Reason|15 Videos
  • STATES OF MATTER

    NCERT FINGERTIPS|Exercise NCERT Exemplar|10 Videos
  • SOME BASIC CONCEPTS OF CHEMISTRY

    NCERT FINGERTIPS|Exercise Assertion And Reason|10 Videos
  • STRUCTURE OF ATOM

    NCERT FINGERTIPS|Exercise Assertion And Reason|15 Videos

Similar Questions

Explore conceptually related problems
The plot of volume versus pressure at constant temperature is a………………………

A plot of P vs T for a given mass of gas at constant volume is a straight line . P vs T at constant volumes V_(1) and V_(2) for an ideal gas are shown below : Which of the following is correct ?

Knowledge Check

  • A plot of volume (V)versus temperature (T) for agas at constant pressure is a straight line passing through the origin the plots at different values of pressure are show in the figure which of the following order of pressure is correct for this gas?

    A
    `p_1gtp_2gtp_3gtp_4`
    B
    `p_1=p_2=p_3=p_4`
    C
    `p_1ltp_2ltP_3ltp_4`
    D
    `p_1ltp_2=p=3ltp_4`
  • For 1 mole of an ideal gas, a graph of pressure vs volume is plotted as shown. Which of the following options is correct ?

    A
    AB process is isothermal
    B
    Maximum temperature of the gas can be `10/0.0821 K`
    C
    Minimum temperature of the gas can be `11/(4xx0.0821) K`
    D
    None of these
  • For 1 mole of an ideal gas, a graph of pressure vs volume is plotted as shown. Which of the following option is correct ?

    A
    AB process is isothermal.
    B
    Maximum temperature of the gas can be `(10)/(0.0821)K`.
    C
    Minimum temperature of the gas can be `(11)/(4 xx 0.0821) K`.
    D
    None of the above
  • Similar Questions

    Explore conceptually related problems

    Volume versus temperature graphs for a given mass of an ideal gas are shown in figure. At two different values of constant pressure. What can be inferred about relation between P_(1) and P_(2) ?

    The volume-temperature graphs of a given mass of an ideal gas at constant pressures are shown below. What is the correct order of pressures ?

    For V versus T curves at constant pressure P_1 and P_2 for and ideal gas shown in figure-

    Which of the following will give a linear plot at constant pressure ?

    Assertion: The plot of volume (V) versus pressure (P) at constant temperature is a hyperbola in the first quadrant. Reason: V prop 1//P at constant temperature.