A
B
C
D
Text Solution
Verified by Experts
The correct Answer is:


Topper's Solved these Questions
PROPERTIES OF SOLIDS AND FLUIDS
CENGAGE PHYSICS|Exercise Assertion- Reasoning|13 VideosPROPERTIES OF SOLIDS AND FLUIDS
CENGAGE PHYSICS|Exercise Linked Comprehension|30 VideosPROPERTIES OF SOLIDS AND FLUIDS
CENGAGE PHYSICS|Exercise Single Correct|112 VideosNEWTON'S LAWS OF MOTION 2
CENGAGE PHYSICS|Exercise Integer type|1 VideosRIGID BODY DYNAMICS 1
CENGAGE PHYSICS|Exercise Integer|11 Videos
Similar Questions
Explore conceptually related problems
CENGAGE PHYSICS-PROPERTIES OF SOLIDS AND FLUIDS-Multiple Correct
- If n drops of a liquid, form a single drop, then
Text Solution
|
- When a capillary tube is dipped in a liquid, the liquid rises to a hei...
Text Solution
|
- A vertical glass capillary tube, open at both ends, contains some wate...
Text Solution
|
- A uniform plank is resting over a smooth horizontal floor and is pulle...
Text Solution
|
- A rod is made of uniform material and has non-uniform cross section. I...
Text Solution
|
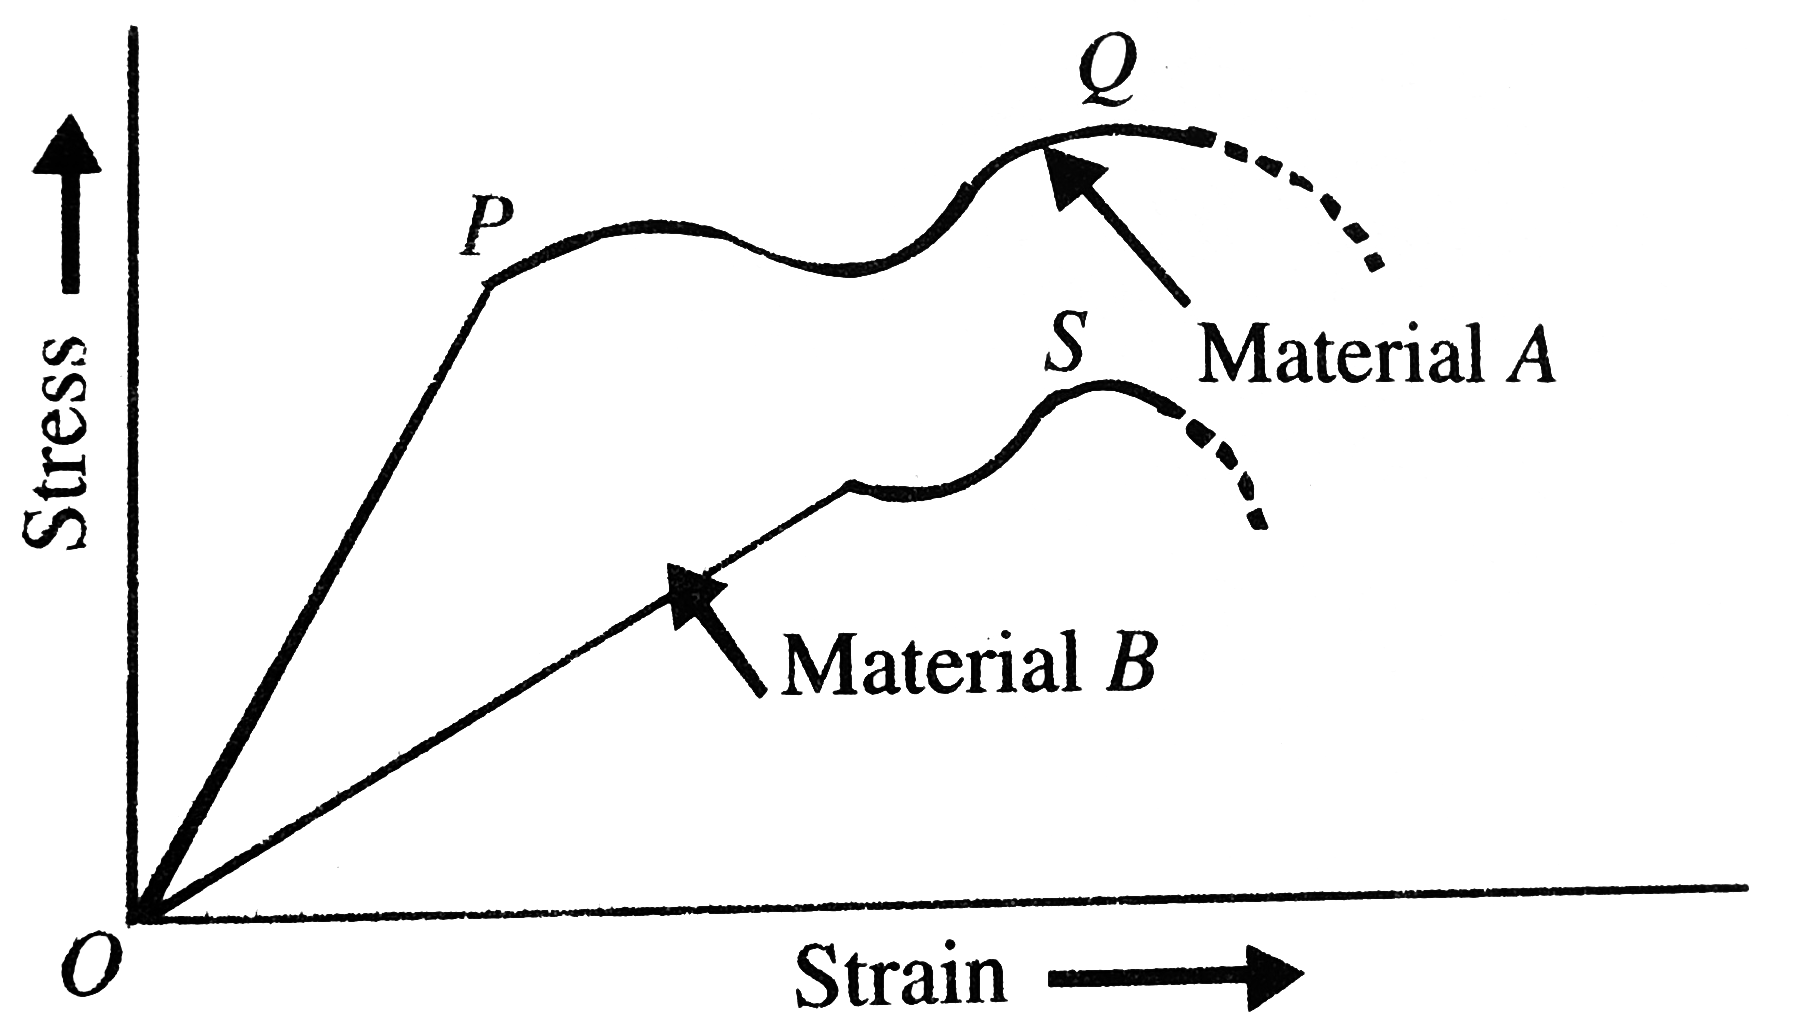
- Figure shows the stress-strain graphs for materials .A and B. From the...
Text Solution
|
- Two wires A and B have the same cross section and are made of the same...
Text Solution
|
- Two wires A and B have equal lengths and are made of the same materi...
Text Solution
|
- Choose the correct statements from the following:
Text Solution
|
- Which of the following are correct?
Text Solution
|
- A light rod of length 2 m is suspended from the ceiling horizontally b...
Text Solution
|
- Which of the following are correct?
Text Solution
|
- Which of the following are correct?
Text Solution
|
- A heavy block of mass 150 kg hangs with the help of three vertical wir...
Text Solution
|
- A body of mass M is attached to the lower end of a metal wire, whose u...
Text Solution
|
- A metal wire of length L, area of cross-section A and young's modulus ...
Text Solution
|
- A tank of large base area is filled with water up to a height of 5 m. ...
Text Solution
|