A
 .
.B
 .
.C
 .
.D
 .
.Text Solution
Verified by Experts
The correct Answer is:


Topper's Solved these Questions
KINEMATICS
PRADEEP|Exercise 2 NCERT multiple|15 VideosKINEMATICS
PRADEEP|Exercise 3 NCERT multiple|161 VideosKINEMATICS
PRADEEP|Exercise 4 Fill in the blanks|11 VideosGRAVIATION
PRADEEP|Exercise Assertion-Reason Type Questions|19 VideosLAWS OF MOTION
PRADEEP|Exercise Assertion- Reason Type Questions|17 Videos
Similar Questions
Explore conceptually related problems
PRADEEP-KINEMATICS-1 NCERT multiple
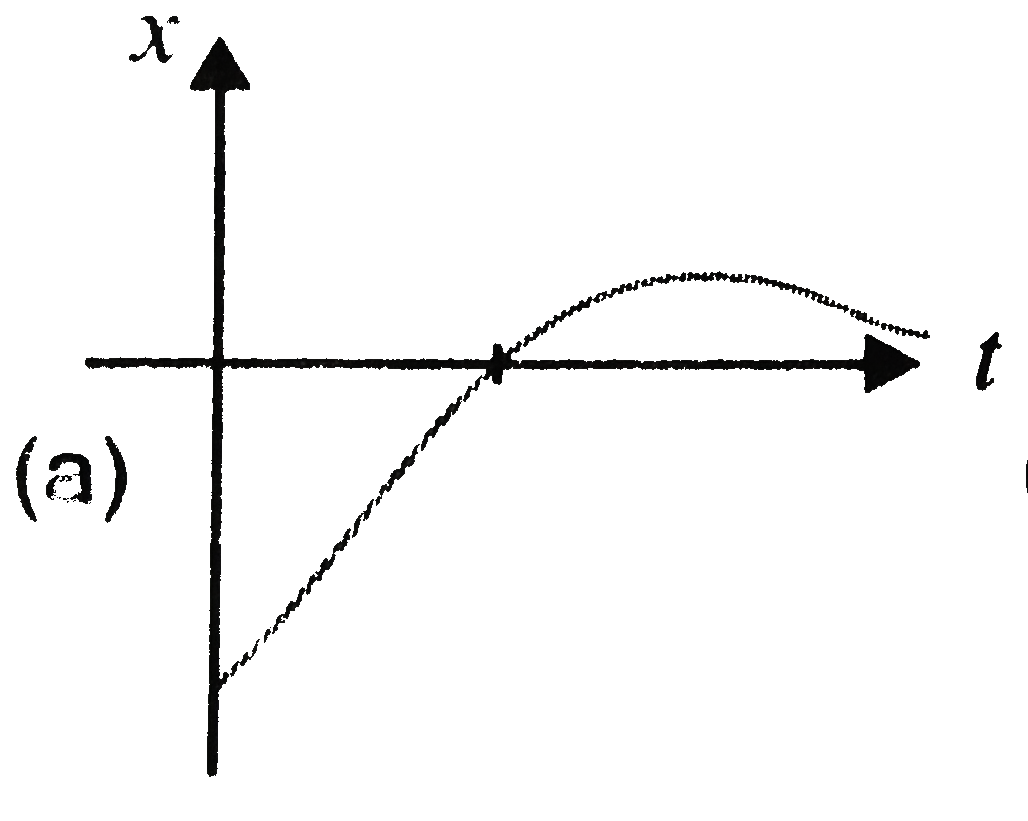
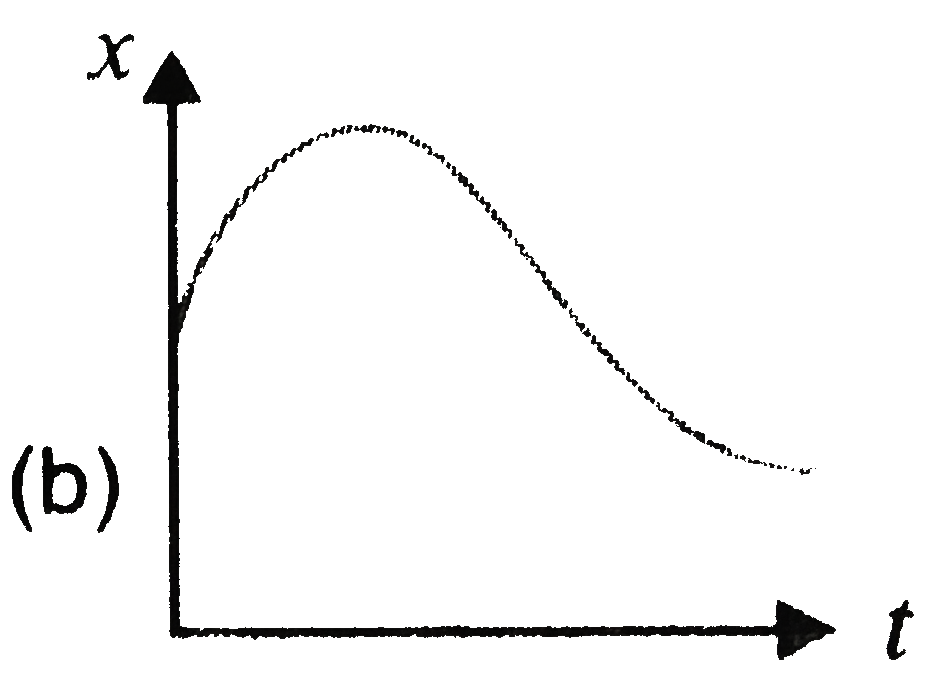
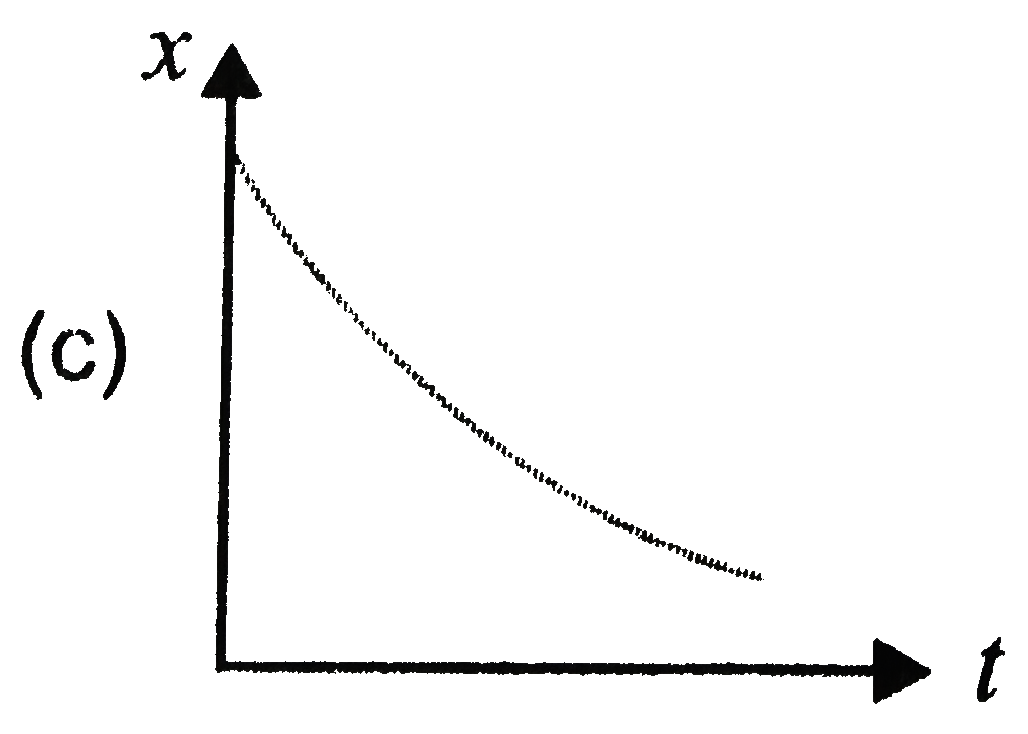
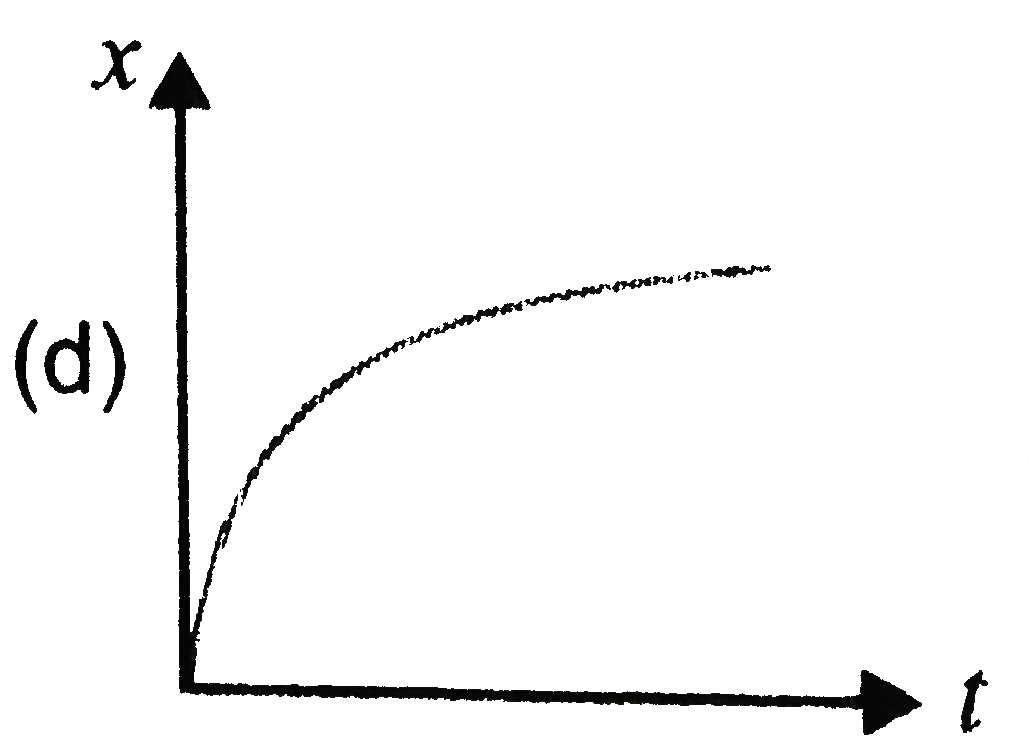
- Among the four graphs shown in the figure there is only one graph for ...
Text Solution
|
- A lift is coming from 8th floor and is just about to reach 4th floor. ...
Text Solution
|
- In one dimensional motion, instantaneous speed v satisfies (0 le v lt ...
Text Solution
|
- A vehicle travels half the distance (L) with speed V1 and the other h...
Text Solution
|
- The displacement of a particle is moving by x = (t - 2)^2 where x is i...
Text Solution
|
- At a metro station, a girl walks up a stationary escalator in time t1 ...
Text Solution
|
- The variation of quantity A with quantity B is plotted in the fig. Des...
Text Solution
|
- A graph of x versus t is shown in figure. Choose correct alternative f...
Text Solution
|
- For the one dimensional motion, described by x=t-sint
Text Solution
|
- A spring with one end attached to a mass and the other to a right supp...
Text Solution
|
- A ball is bouncing elastically with a speed 1 m//s between walls of a ...
Text Solution
|