Text Solution
Verified by Experts


Topper's Solved these Questions
KINEMATICS
PRADEEP|Exercise 1 NCERT Assertion-Reaseon Type|14 VideosKINEMATICS
PRADEEP|Exercise 1 NCERT Comprehension|4 VideosKINEMATICS
PRADEEP|Exercise 4 NCERT multiple Choice|10 VideosGRAVIATION
PRADEEP|Exercise Assertion-Reason Type Questions|19 VideosLAWS OF MOTION
PRADEEP|Exercise Assertion- Reason Type Questions|17 Videos
Similar Questions
Explore conceptually related problems
PRADEEP-KINEMATICS-4 NCERT Integer type
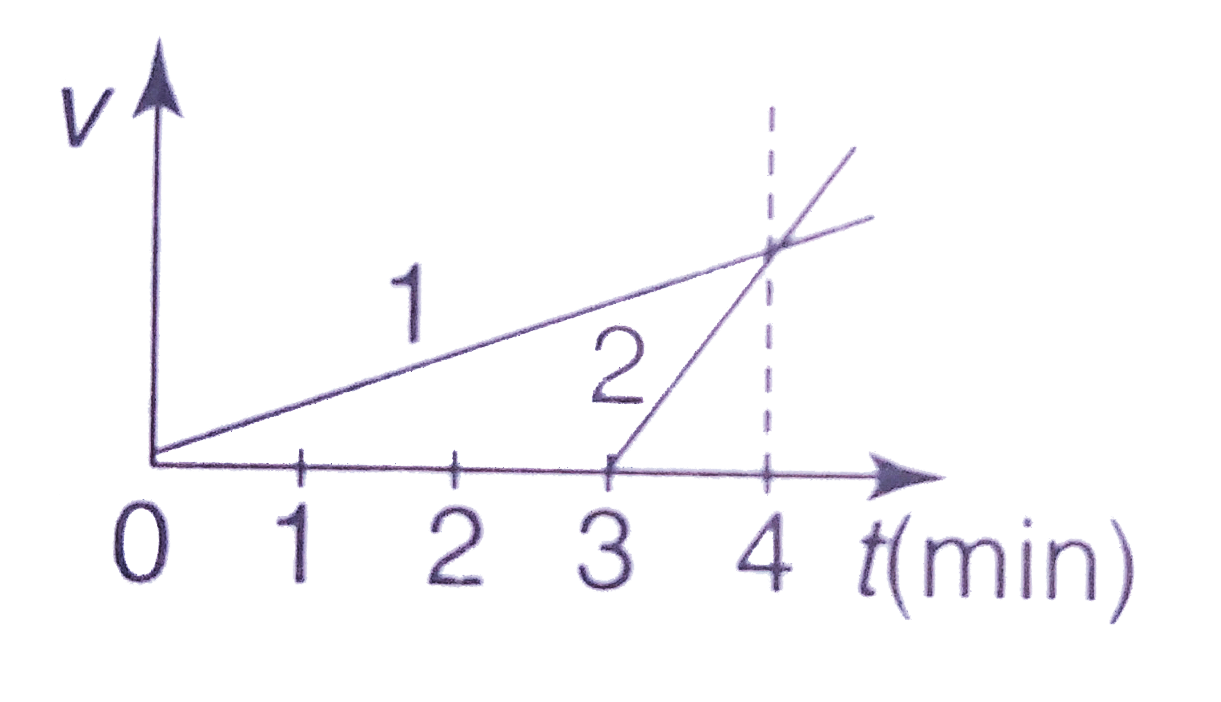
- The drawing shows velocity (v) versus time (t) graphs for two cyclists...
Text Solution
|
- A body falling from rest was observed to fall through 78.4m in 2 secon...
Text Solution
|
- Ball are dropped from the roop fo towar at fived interval if tiem . At...
Text Solution
|
- A bird flies for 4 s with a velocity v=(t-2) ms^(-1) in a straight lin...
Text Solution
|