A
B
C
D
Text Solution
Verified by Experts
The correct Answer is:


Topper's Solved these Questions
STATES OF MATTER
R SHARMA|Exercise Follow -up Test 5|8 VideosSTATES OF MATTER
R SHARMA|Exercise Follow -up Test 6|13 VideosSTATES OF MATTER
R SHARMA|Exercise Follow -up Test 3|7 VideosSOME BASIC CONCEPTS OF CHEMISTRY
R SHARMA|Exercise Archives|26 VideosSTRUCTURE OF ATOM
R SHARMA|Exercise ARCHIVES|55 Videos
Similar Questions
Explore conceptually related problems
R SHARMA-STATES OF MATTER-Follow -up Test 4
- For each degree rise in temperature , the volume of a gas increases by...
Text Solution
|
- The volume of an ideal gas becomes zero at
Text Solution
|
- Theoretically , the lowest attainable temperature is
Text Solution
|
- The volume of a gas is directly proportional to the temperature (const...
Text Solution
|
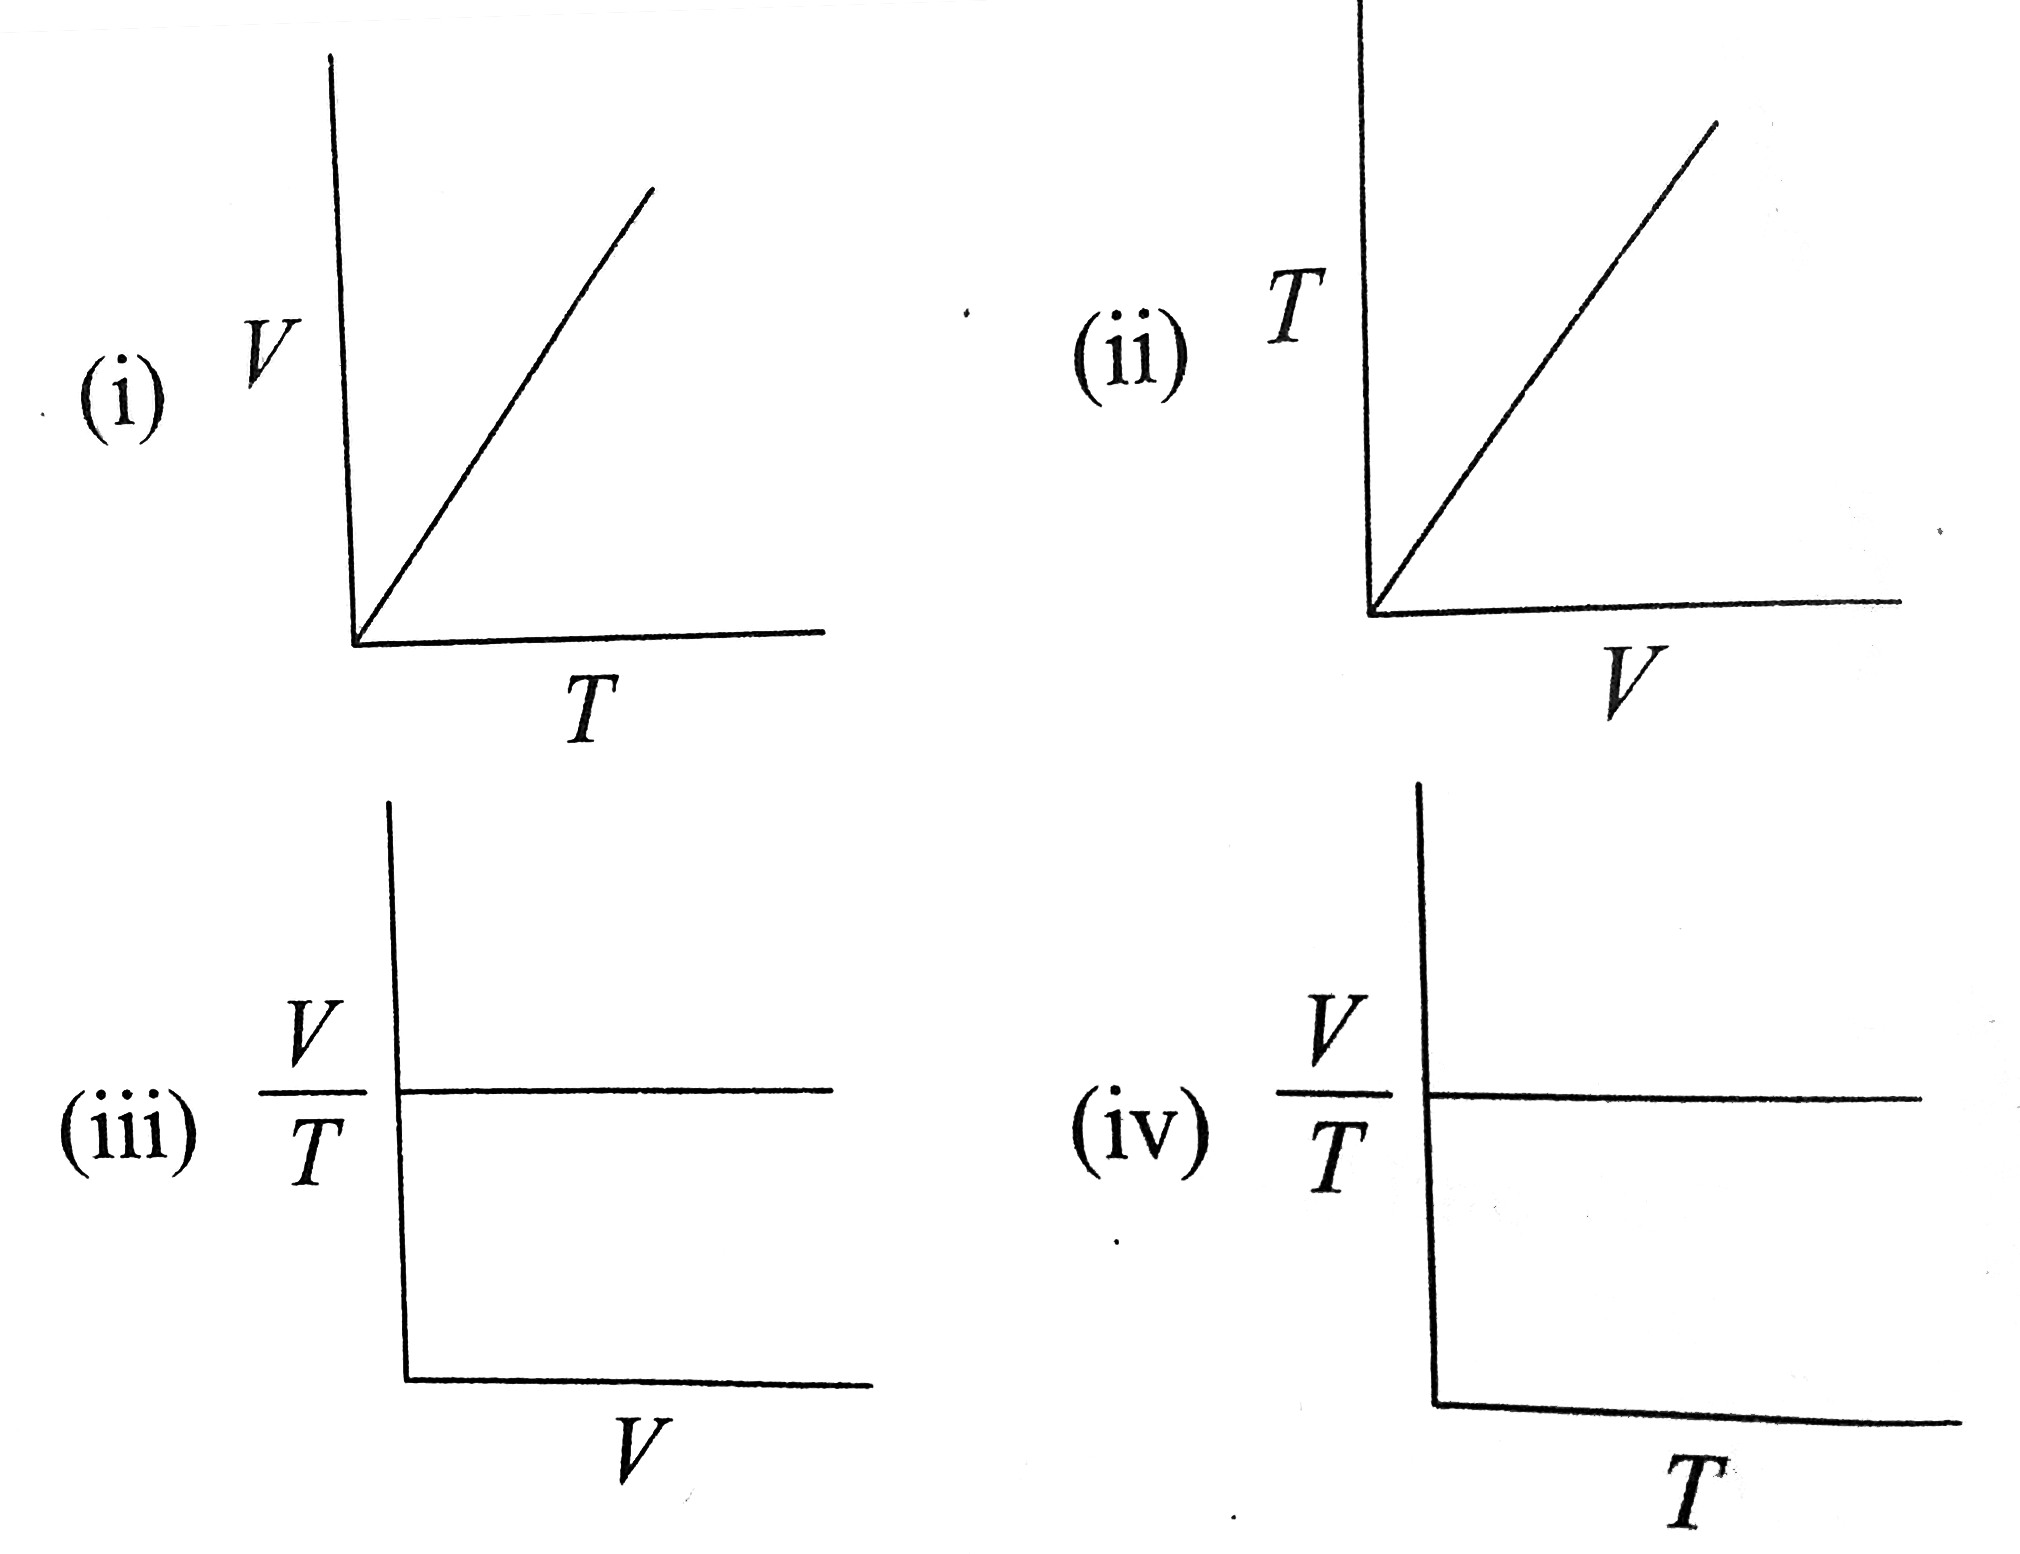
- which of the following graphs represents Charles' law correctly ?
Text Solution
|
- Which of the following expressions represents Charles' law?
Text Solution
|