A
B
C
D
Text Solution
Verified by Experts
The correct Answer is:


Topper's Solved these Questions
Similar Questions
Explore conceptually related problems
RESONANCE-TEST PAPERS-PART - III CHEMISTRY
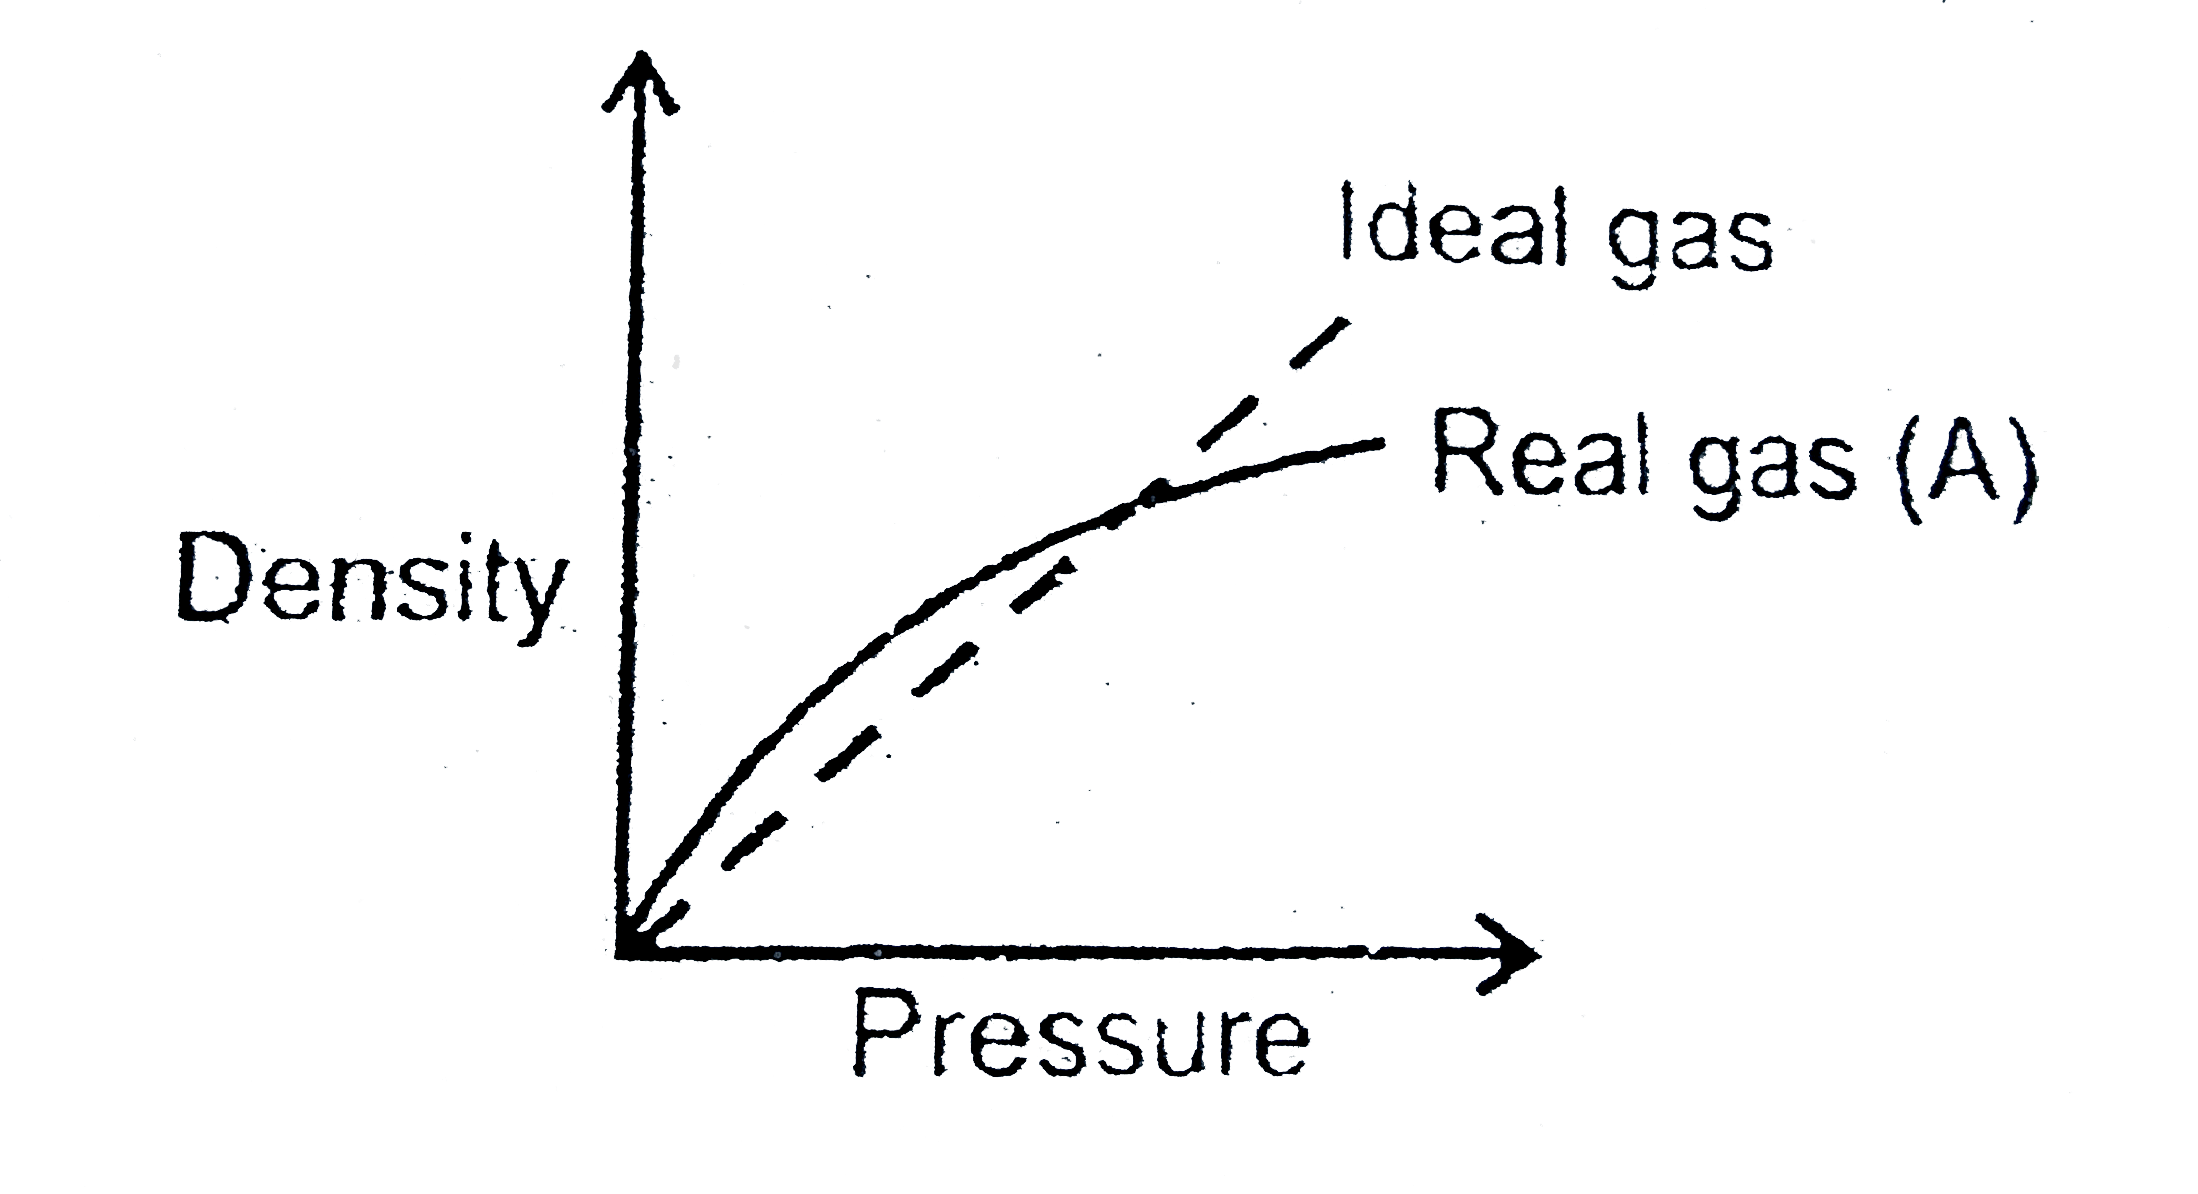
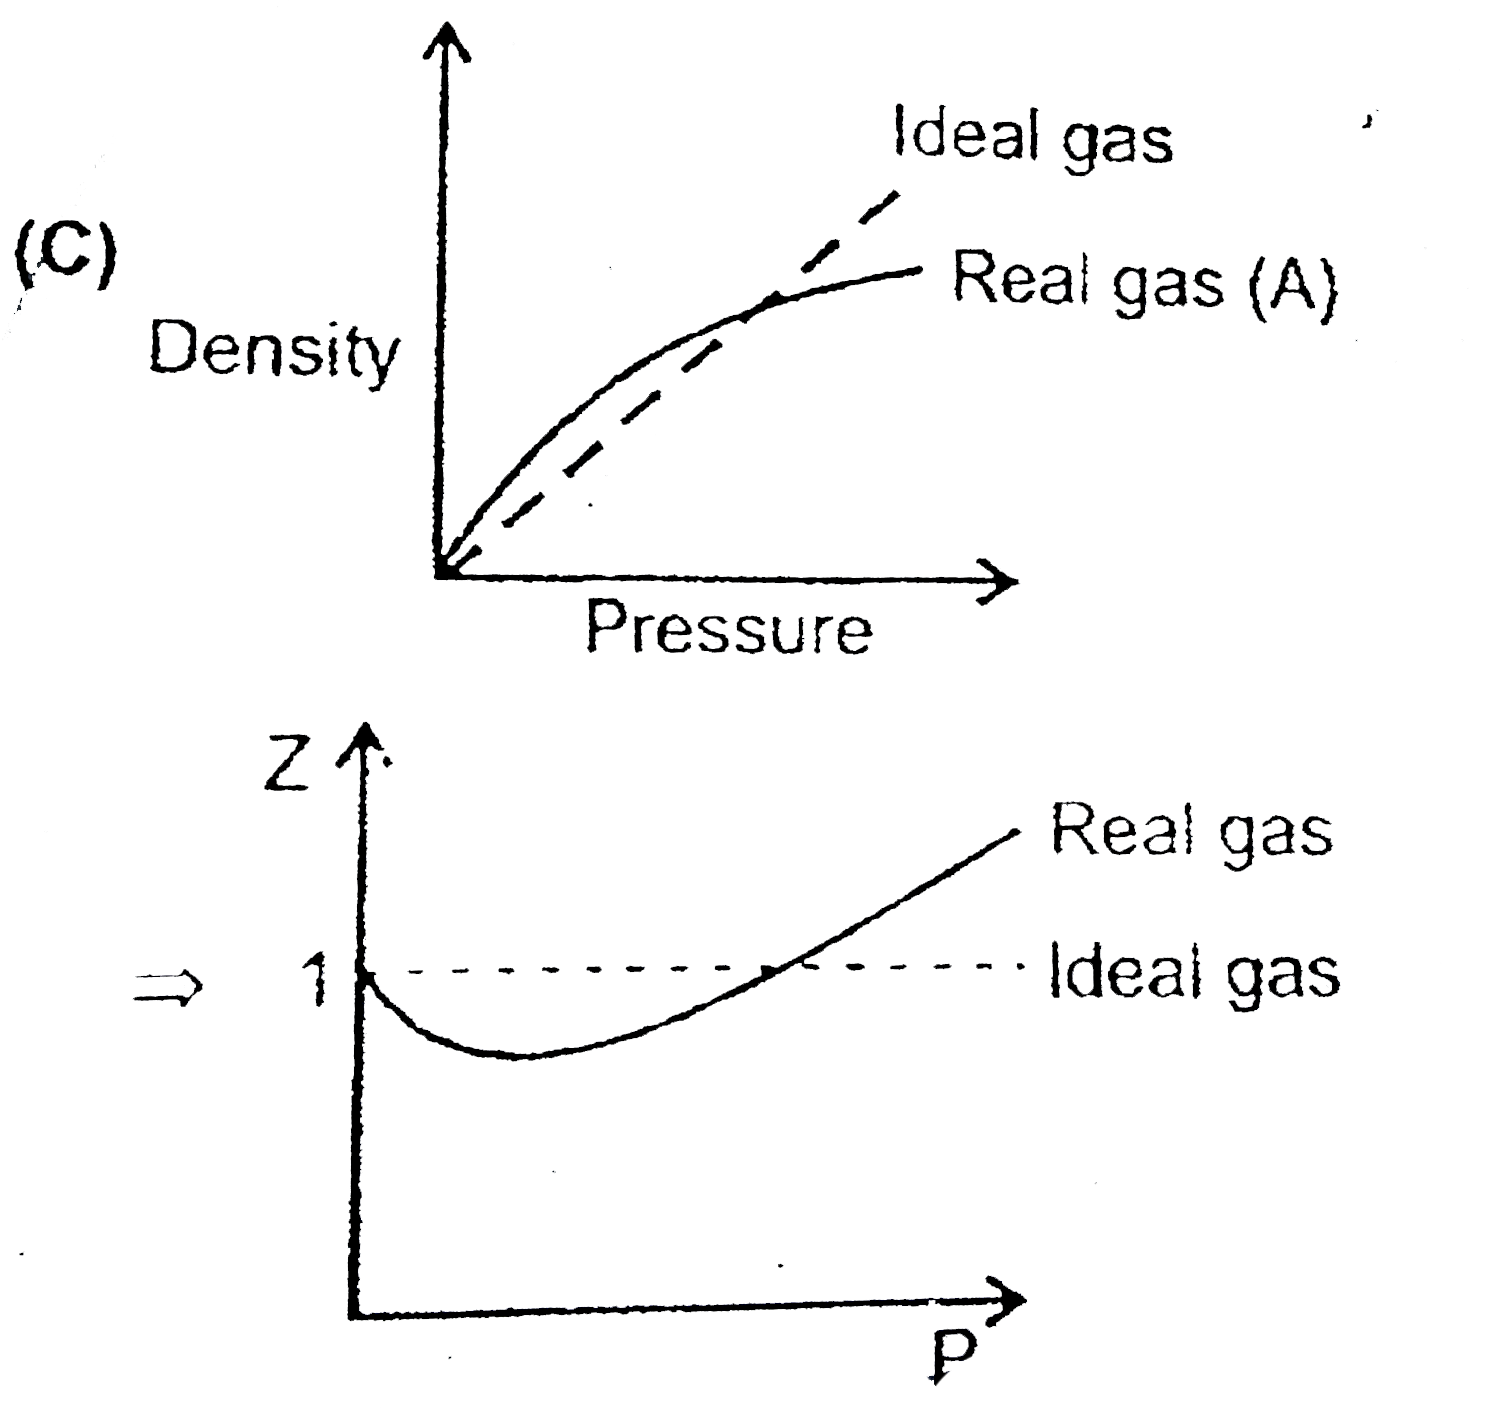
- A gas shows following graphs at 25^(@)C Which is/are correct for ...
Text Solution
|
- 30 mL of CH(3)OH (d = 0.8 g//cm^(3)) is mixed with 60 mL of C(2)H(5)OH...
Text Solution
|
- For the dissociation A(2)B(3)hArr2AB(g) + (1)/(2)B(2)(g) If, M = M...
Text Solution
|
- For the endothermic reaction 3A(g) hArr B(g) + C(g) select the opt...
Text Solution
|
- Select the correct statement(s) :
Text Solution
|
- Consider the following arrangement : If O(2) and N(2) are assumed...
Text Solution
|
- a A((g)) + bB((g)) rarr cC((g)) + d D((g)) Reaction is taking place ...
Text Solution
|
- A liquid confined inside an adiabatic is suddenly taken from state 1 t...
Text Solution
|
- 1 mol of an idel gas is allowed to expand isothermally at 27^(@)C til...
Text Solution
|
- Amongs the following select incorrect statement(s) for kinectic energy...
Text Solution
|
- which of the following order/s is/are cprrect fpr the properties menti...
Text Solution
|
- In which of the following one benzene ring is attched to + m and anoth...
Text Solution
|
- The oimpossible resonating structures of fluorobenzene is/are :
Text Solution
|
- Find out correct statement/s about squaric acid diansion:
Text Solution
|
- Which of the following groups exerts +m effect when attached with benz...
Text Solution
|
- Among the following reaction, which from salicylic acid.
Text Solution
|
- Which of the following statements is/are correct?
Text Solution
|
- From the compound shown below, choose which is/are aromatic.
Text Solution
|
- Whch of the following has/have non-zero dipole moment?
Text Solution
|
- The correct stablity order of following resonating structure is/are :
Text Solution
|