A
B
C
D
Text Solution
Verified by Experts
The correct Answer is:


Topper's Solved these Questions
Similar Questions
Explore conceptually related problems
BITSAT GUIDE-CHEMICAL KINETICS-BITSAT Archives
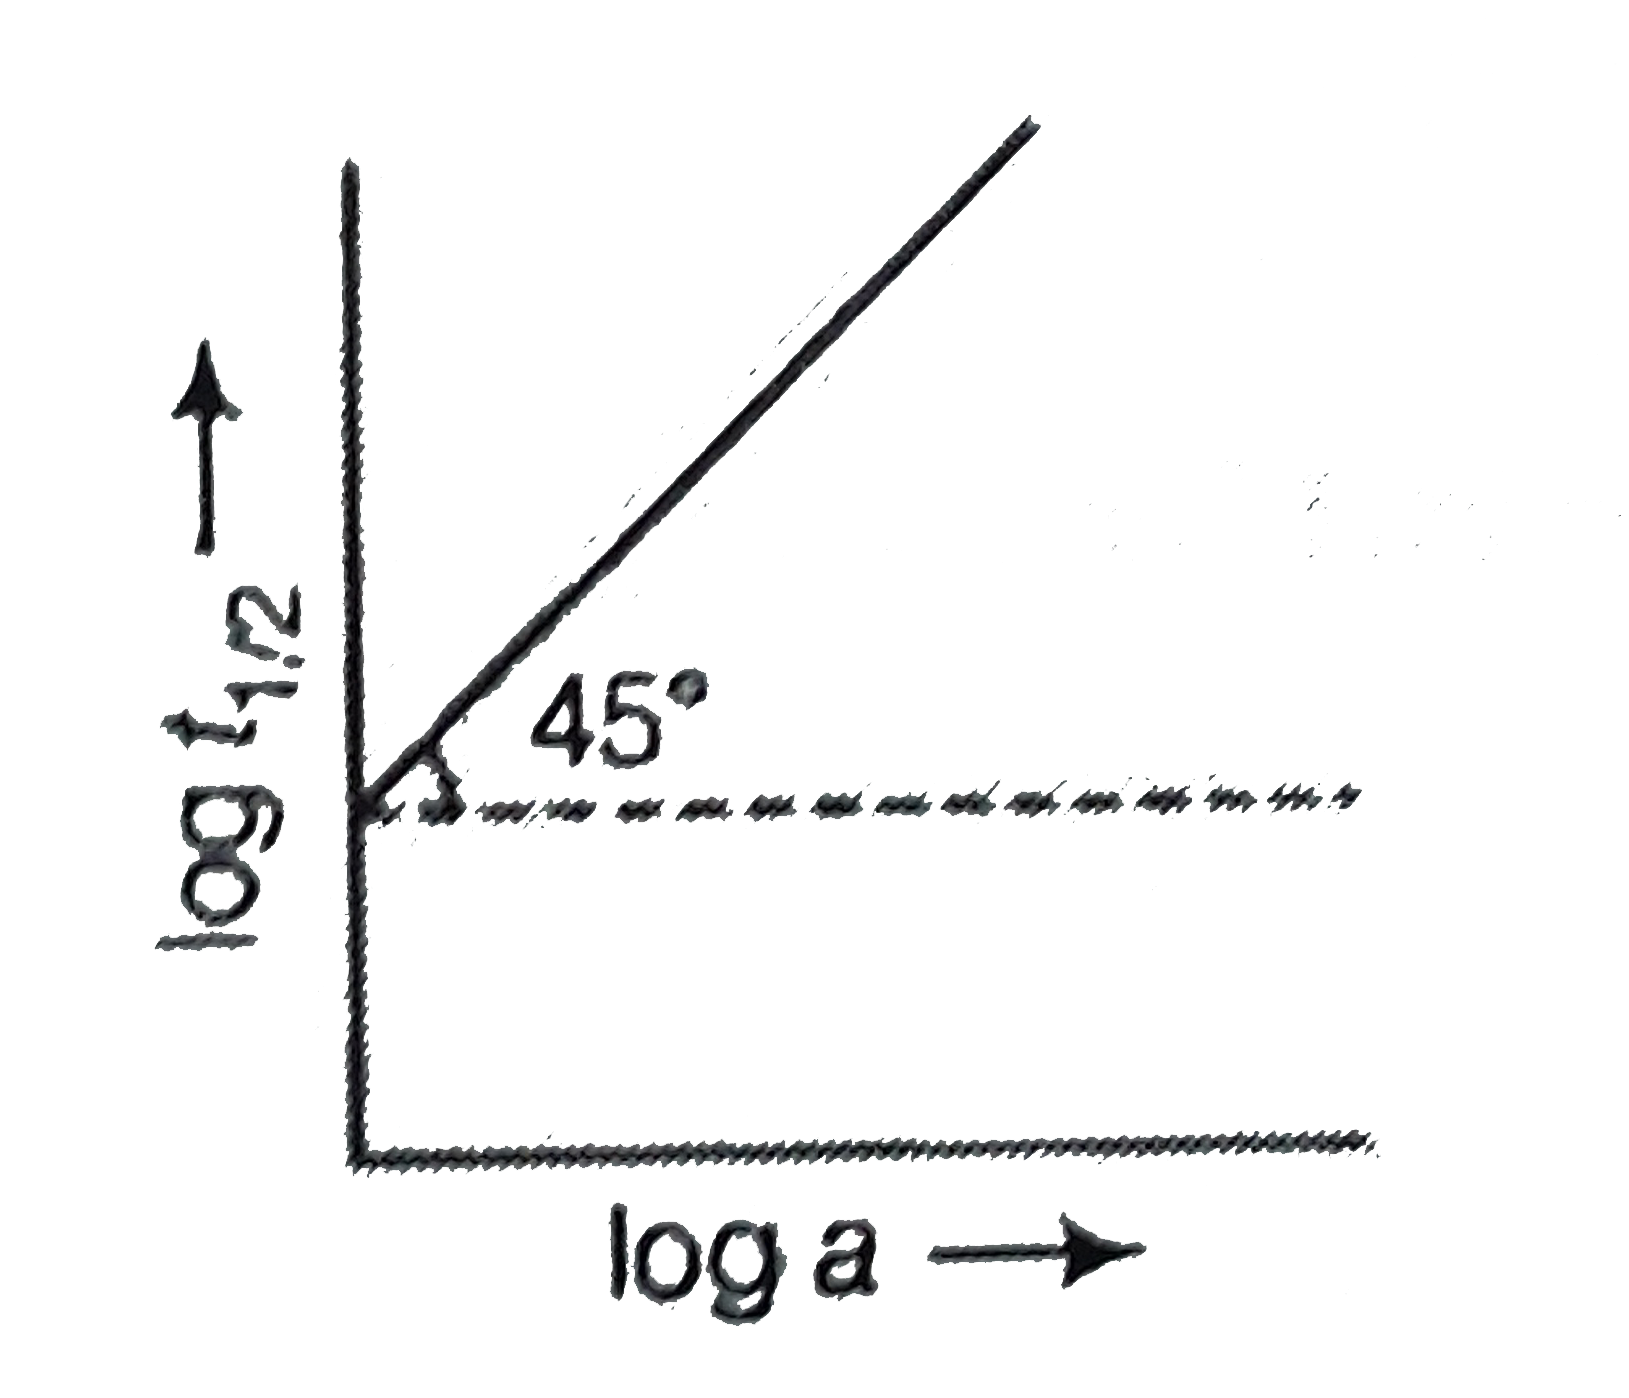
- Following is the graph between log T(50) and log a (a = initial conce...
Text Solution
|
- Choose the law that corresponds to data shown for the reaction, A + B ...
Text Solution
|
- A reaction takes place in three steps. The rate constant are k(1), k(2...
Text Solution
|
- Consider the following reaction 2N(2)O(5)iff 4NO(2)+O(2). If ra...
Text Solution
|
- For a given reaction, t(1//2) = 1 //ka. The order of this reaction is
Text Solution
|
- The time taken for 90% of a first order reaction to be completed is a...
Text Solution
|
- What is the energy of activation of a reaction is its rate doubles whe...
Text Solution
|
- The active mass of solid is generally taken as
Text Solution
|
- Following is the graph between log T(50) and log a (a = initial concen...
Text Solution
|
- Select the law that corresponds to data shown for the following reacti...
Text Solution
|
- A reaction takes place in three steps. The rate constant are k(1), k(2...
Text Solution
|
- Consider the following reaction 2N(2)O(5)iff 4NO(2)+O(2). If ra...
Text Solution
|
- For a given reaction, t(1//2) = 1 //ka. The order of this reaction is
Text Solution
|
- The time taken for 90% of a first order reaction to be completed is a...
Text Solution
|
- What is the energy of activation of a reaction is its rate doubles whe...
Text Solution
|
- The active mass of solid is generally taken as
Text Solution
|