Home
Class 11
CHEMISTRY
A graph is plotted between p (atm) vs t^...

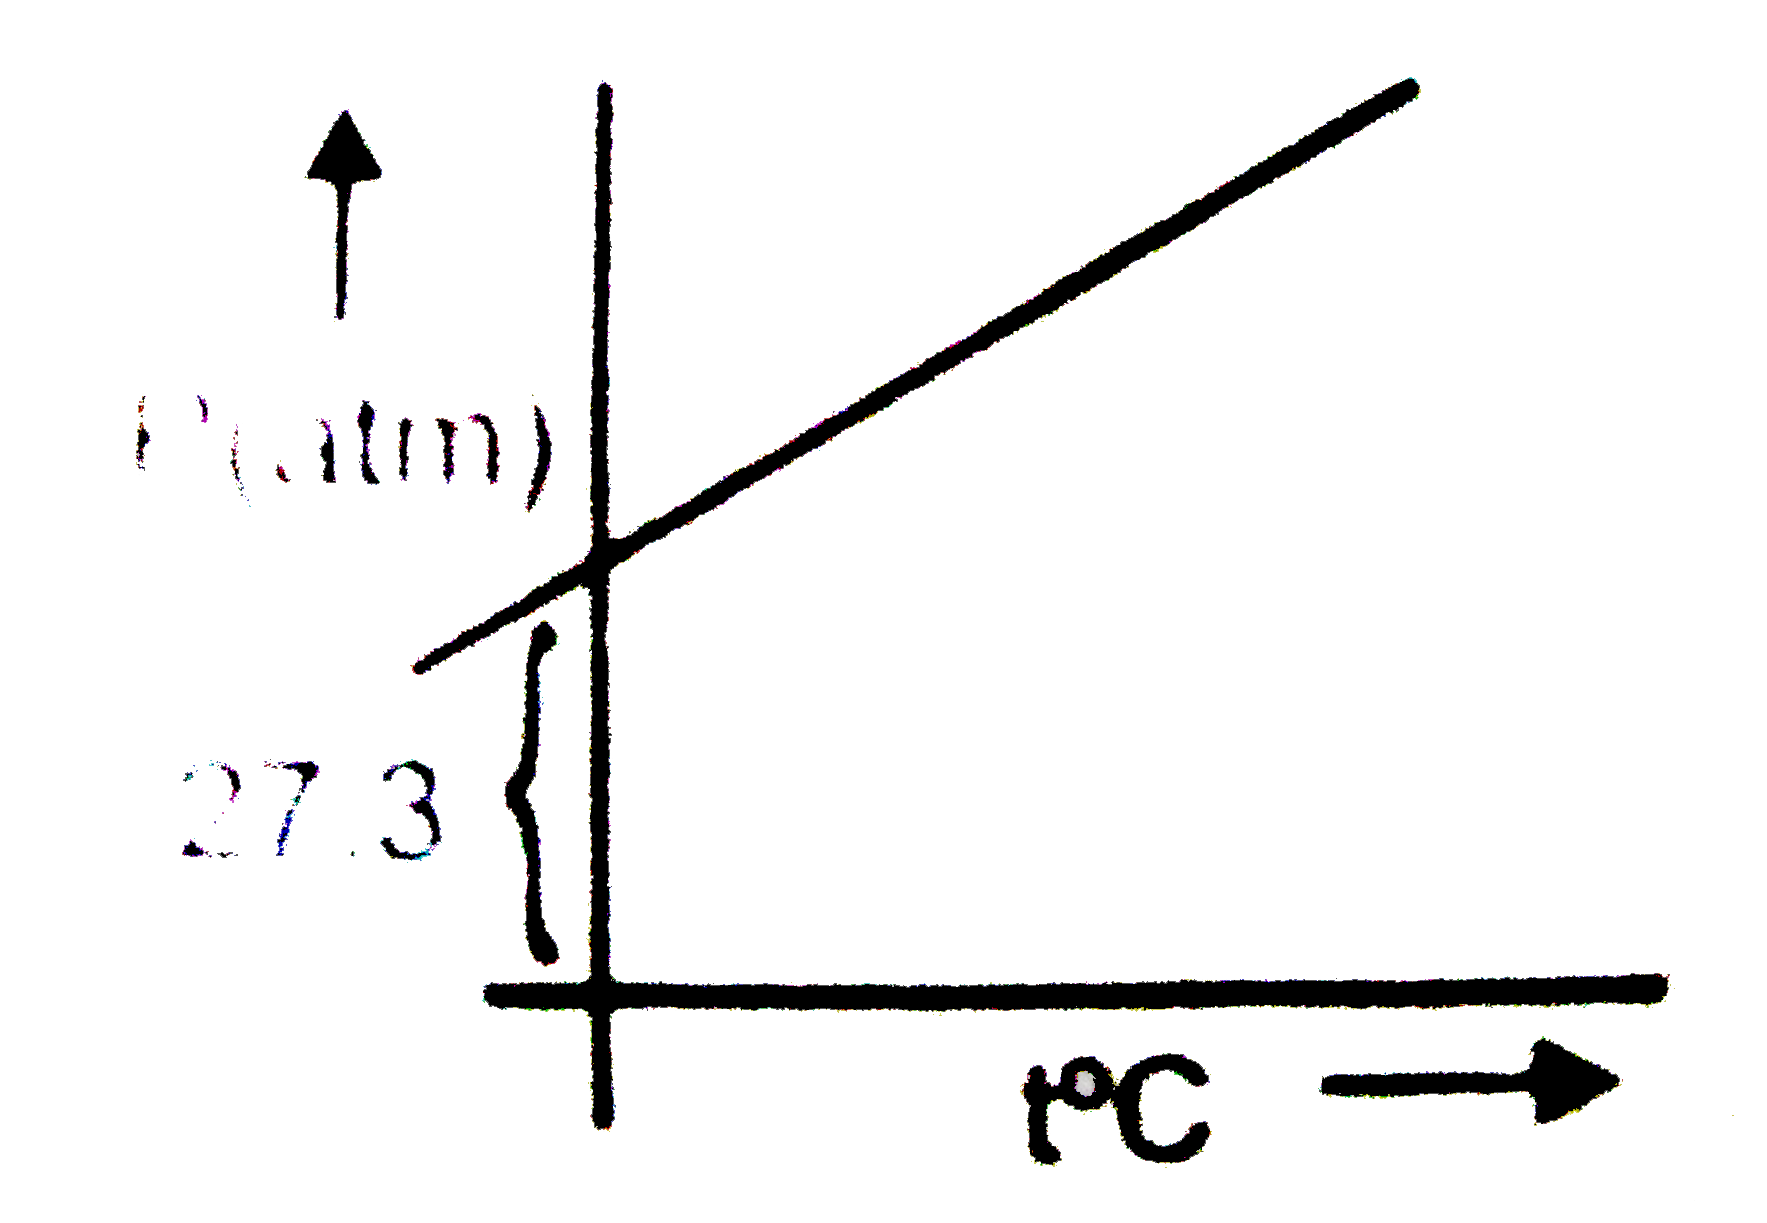
A graph is plotted between p (atm) vs `t^(@)C` for 10 mol of an ideal gas as follows:
Then slope of curve and volume of container (L) respectively, are:

A

0.1,8.21

B

8.21,0.1

C

27.3,8.21

D

8.21,27.3

Text Solution

Verified by Experts

The correct Answer is:
a
Doubtnut Promotions Banner Mobile Dark
|

Topper's Solved these Questions

  • GASEOUS STATE

    NARENDRA AWASTHI|Exercise Level 3 - Passage|1 Videos
  • GASEOUS STATE

    NARENDRA AWASTHI|Exercise Level 3 - Subjective Problems|1 Videos
  • GASEOUS STATE

    NARENDRA AWASTHI|Exercise Level 1 (Q.151 To Q.176)|1 Videos
  • ELECTROCHEMISTRY

    NARENDRA AWASTHI|Exercise Level 3 - Subjective Problems|1 Videos
  • IONIC EEQUILIBRIUM

    NARENDRA AWASTHI|Exercise Exercise|196 Videos

Similar Questions

Explore conceptually related problems
Which one of the following is the correct PV vs P plot at constant temperature for an ideal gas ? (P and V stand for pressure and volume of the gas respectively)

For a fixed amount of a real gas when a graph of Z us P was plotted then at very high pressure slope was observed to be 0.01 atm^(-1) . At the same temperature if a graph is plotted between PV us P then for 2 moles of the gas the y intercept is found to be 40 atm-litre. Calculate excluded volume in litres for 20 moles of the real gas/

Knowledge Check

  • A graph plotted between log k vs (1)/(T) is represented by

    A
    B
    C
    D
  • A graph plotted between log N vs, time gives a slope and intercept equal to:

    A
    `-(lambda)/(2.303), log N_(0)`
    B
    `(lambda)/(2.303), log N_(0)`
    C
    `- (lambda)/(2.303), N_(0)`
    D
    `(lambda)/(2.303), N_(0)`
  • The volume vs. temperature graph of 1 mole of an ideal gas is given below The pressure of the gas (in atm) at X, Y and Z, respectively, are

    A
    `0.328,0.820, 0.820`
    B
    `3.28, 8.20,3.28`
    C
    `0.238, 0.280, 0.280`
    D
    `32.8, 0.280, 82.0`
  • Similar Questions

    Explore conceptually related problems

    A graph plotted between log K vs 1//T for calculating activation energy is shown by

    The volume of 10 "moles" of an ideal gas at 10 atm and 500 K is

    On the recently discovered 10^(th) planet it has been found that the gases follow the relationship Pe^(V//2) =nCT where C is constant other notation are as usual( V in lit.,P in atm andTinKelvin) . A curve is plotted between P and V at 500 K & 2 moles of gas as shown in figure. Find the slope of the curve plotted between P Vs T for closed container of volume 2 lit. having same moles of gas

    The P-T graph for the given mass of an ideal gas is shown in figure. Then the volume

    On the recently discovered 10^(th) planet it has been found that the gases follow the relationship Pe^(V//2) =nCT where C is constant other notation are as usual( V in lit.,P in atm andTinKelvin) . A curve is plotted between P and V at 500 K & 2 moles of gas as shown in figure. If a closed container of volume 200 lit. of O_(2) gas ( ideal gas ) at 1 atm& 200K is taken to planet.Find the pressure of oxygen gas at the planet at 821 K in same container