Home
Class 6
MATHS
Look at the bar graph given below. ...

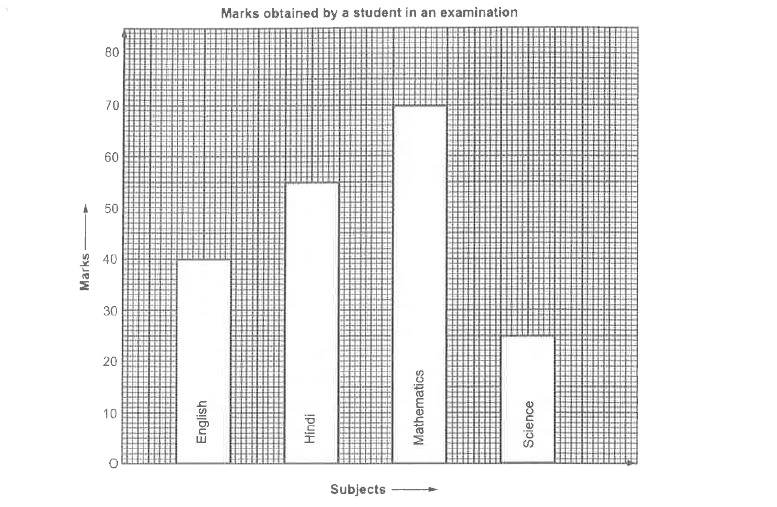
Look at the bar graph given below.

Read if cerefully and answer the questions given below:
What information does the bar graph give ?
In which subject is the student poorest ?
In which subject is the student best ?
In which subjects did he get more than 40 marks ?

Text Solution

Verified by Experts

The correct Answer is:
(I) The given bar graph shows the marks obtained by a student in each of the four subjects in an examination.
(ii) The student is poorest in Science.
(iii) The student is best in Mathematics.
(iv) He got more than 40 marks in Hindi and Mathematics.
Doubtnut Promotions Banner Mobile Dark
|

Topper's Solved these Questions

  • BAR GRAPH

    RS AGGARWAL|Exercise EXERCISE|4 Videos
  • ANGLES AND THEIR MEASUREMENT

    RS AGGARWAL|Exercise EXERCISE D|13 Videos
  • CIRCLES

    RS AGGARWAL|Exercise C. WRITE T FOR TRUE AND F FOR FALSE FOR EACH OF THE STATEMENTS GIVEN BELOW:|1 Videos

Similar Questions

Explore conceptually related problems

Look at the bar graph given below Read it carefully and answer the following questions Q(i) What information does the bar graph give (ii) In which subject is the student very good (iii) In which subject is he poor (iv) What is the average of his marks

Read the bar graph given below and answer the following questions: What information is given by the þar graph?

Knowledge Check

  • Read the following graph and answer the question given below At what subject is the student sharp?

    A
    English
    B
    Mathematics
    C
    Science
    D
    History
  • Read the following graph and answer the questions given below-: In which subject is the student poor?

    A
    english
    B
    mathematics
    C
    science
    D
    history
  • Similar Questions

    Explore conceptually related problems

    Read the following bar graph given in figure and answer the following questions. (i) What information is given by this bar graph?

    The graph given below shows the marks obtained out of 10 by Sonia in two different tests. Study the graph and answer the questions that follow. (a) What information is represented by the axes? (b) In which subject did she score the highest in Test I? (c) In which subject did she score the least in Test II? (d) In which subject did she score the same marks in both the Tests? (e) What are the marks scored by her in English in Test II? (f) In which test was the performance better? (g) In which subject and which test did she score full marks?

    Read the bar graph and answer the following questons. What information is given by graph ?

    Given below is a bar graph showing the marks obtained by Tarun in few subjects in an annual examination. Read the bar graph carefully and answer the question given below : In which subject does Taun get the lowest marks ? In which subject does Tarun get the highest marks ? How many marks does he get in English ? In which subjects does Tarun get less than 50 marks ?

    Study the bar graph given below and answer the questions that follow (a) What information is depicted from the bar graph? (b) In which subject is the student very good? (c) Calculate the average marks of the student. (d) If 75 and above marks denote a distinction, then name the subjects in which the student got distinction. (e) Calculate the percentage of marks the student got out of 500.

    Read the bar graph shown in figure and answer the following questions. What is the information given by the bar graph?