A
B
C
D
Text Solution
AI Generated Solution
The correct Answer is:


Topper's Solved these Questions
STATES OF MATTER : GASES AND LIQUIDS
MODERN PUBLICATION|Exercise COMPETITION FILE OBJECTIVE TYPE QUESTIONS (B. MULTIPLE CHOICE QUESTIONS)(JEE (ADVANCED) FOR IIT ENTRANCE)|8 VideosSTATES OF MATTER : GASES AND LIQUIDS
MODERN PUBLICATION|Exercise COMPETITION FILE OBJECTIVE TYPE QUESTIONS (C. MULTIPLE CHOICE QUESTIONS)|10 VideosSTATES OF MATTER : GASES AND LIQUIDS
MODERN PUBLICATION|Exercise COMPETITION FILE OBJECTIVE TYPE QUESTIONS (B. MULTIPLE CHOICE QUESTIONS)|32 VideosSOME BASIC CONCEPTS OF CHEMISTRY
MODERN PUBLICATION|Exercise COMPETITION FILE (INTEGER TYPE AND NUMERICAL VALUE TYPE QUESTIONS)|10 VideosSTRUCTURE OF ATOM
MODERN PUBLICATION|Exercise Unit Practice Test|13 Videos
Similar Questions
Explore conceptually related problems
MODERN PUBLICATION-STATES OF MATTER : GASES AND LIQUIDS-COMPETITION FILE OBJECTIVE TYPE QUESTIONS (B. MULTIPLE CHOICE QUESTIONS)(JEE (MAIN) & OTHER STATE BOARDS FOR ENGINEERING ENTRANCE)
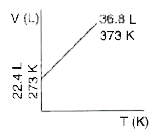
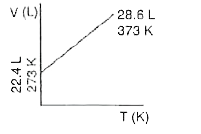
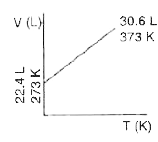
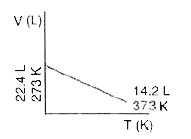
- Which one of the following volume (V)- temperature (T) plots represent...
Text Solution
|
- Equal masses of methane and oxygen are mixed in an empty container at ...
Text Solution
|
- In order to increase the volume of a gas by 10% , the pressure of the ...
Text Solution
|
- 100 mL of O(2) and H(2) are kept at same temperature and pressure. Wha...
Text Solution
|
- The rms velocity molecules of a gas of density 4 kg m^(-3) and pressur...
Text Solution
|
- The density of a gas a is twice that of gas B. Molecular mass of A is ...
Text Solution
|
- At identical temperature and pressure, the rate of diffusion of hydrog...
Text Solution
|
- For one mole of an ideal gas, increasing the temperature from 10^(@)C ...
Text Solution
|
- If 10^(-4) dm^(3) of water is introduced into a 1.0 dm^(3) flask to 30...
Text Solution
|
- The rms velocity of hydrogen is sqrt(7) times the rms velocity of nitr...
Text Solution
|
- a' and 'b' are van der Waals' constants for gases Chlorine is more eas...
Text Solution
|
- Two vessels of volumes 16.4 L and 5 L contain two ideal gases of molec...
Text Solution
|
- For gaseous state, if most probable speed is denoted by C^(**) average...
Text Solution
|
- At a certain temperature, the time required for the complete diffusion...
Text Solution
|
- Four gases P, Q, R andS have almost same values of 'b' but their 'a' v...
Text Solution
|
- If two moles of an ideal gas at 500 K occupies a volume of 41 litres, ...
Text Solution
|
- At 273 K, the density of a certain gaseous oxide at 2 atmosphere is sa...
Text Solution
|
- Density of carbon monoxide is maximum at
Text Solution
|
- If Z is a compressibility factor, van der Waals' equation at low press...
Text Solution
|
- One mole of N(2)O(4) gas at 300 K is kept in a closed container at 1 a...
Text Solution
|