A
B
C
D
Text Solution
Verified by Experts
The correct Answer is:


Topper's Solved these Questions
RACE
ALLEN|Exercise Basic Maths (Thermal Physics) (Thermodynamic process)|20 VideosRACE
ALLEN|Exercise Basic Maths (Dscillations) (Kinematics of SHM)|20 VideosRACE
ALLEN|Exercise Basic Maths (Thermal Physics) (Mode of Heat Transfer)|14 VideosNEWTONS LAWS OF MOTION
ALLEN|Exercise EXERCISE-III|28 VideosSIMPLE HARMONIC MOTION
ALLEN|Exercise Example|1 Videos
Similar Questions
Explore conceptually related problems
ALLEN-RACE-Basic Maths (Thermal Physics) (Kinetic theory of gasess)
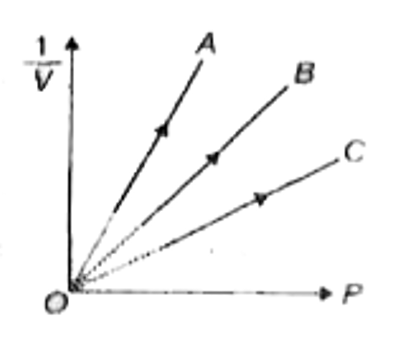
- Figure shows the isotherms of a fixed mass of an ideal gas at three te...
Text Solution
|
- The ratio of number of collisions per second at the walls of container...
Text Solution
|
- if hydrogen gas is heated to a very high temperature, then the fracti...
Text Solution
|
- The rms speed of helium gas at 27^(@)C and 1 atm pressure is 900 ms^(-...
Text Solution
|
- Figure shows two flasks connected to each other. The volume of flask 1...
Text Solution
|
- One mole of a diatomic.gas undergoes a process p=(p(0))/(1+((V)/(V(0))...
Text Solution
|
- An ideal gas has an initial pressure of 3 pressure units and an initia...
Text Solution
|
- Statement-1 : At low pressure and high temperature real gas approaches...
Text Solution
|
- A vessel contains a mixture of 7 g of nitrogen and 11 g carbon dioxide...
Text Solution
|
- Figure shows a process for a given amount of an ideal gas. If volume i...
Text Solution
|
- Pressure versus temperature graph of an ideal gas of equal number of a...
Text Solution
|
- At 20^(@)C temperature, an argon gas at atmospheric pressure is confin...
Text Solution
|