Home
Class 11
CHEMISTRY
Match the graphs between the following v...

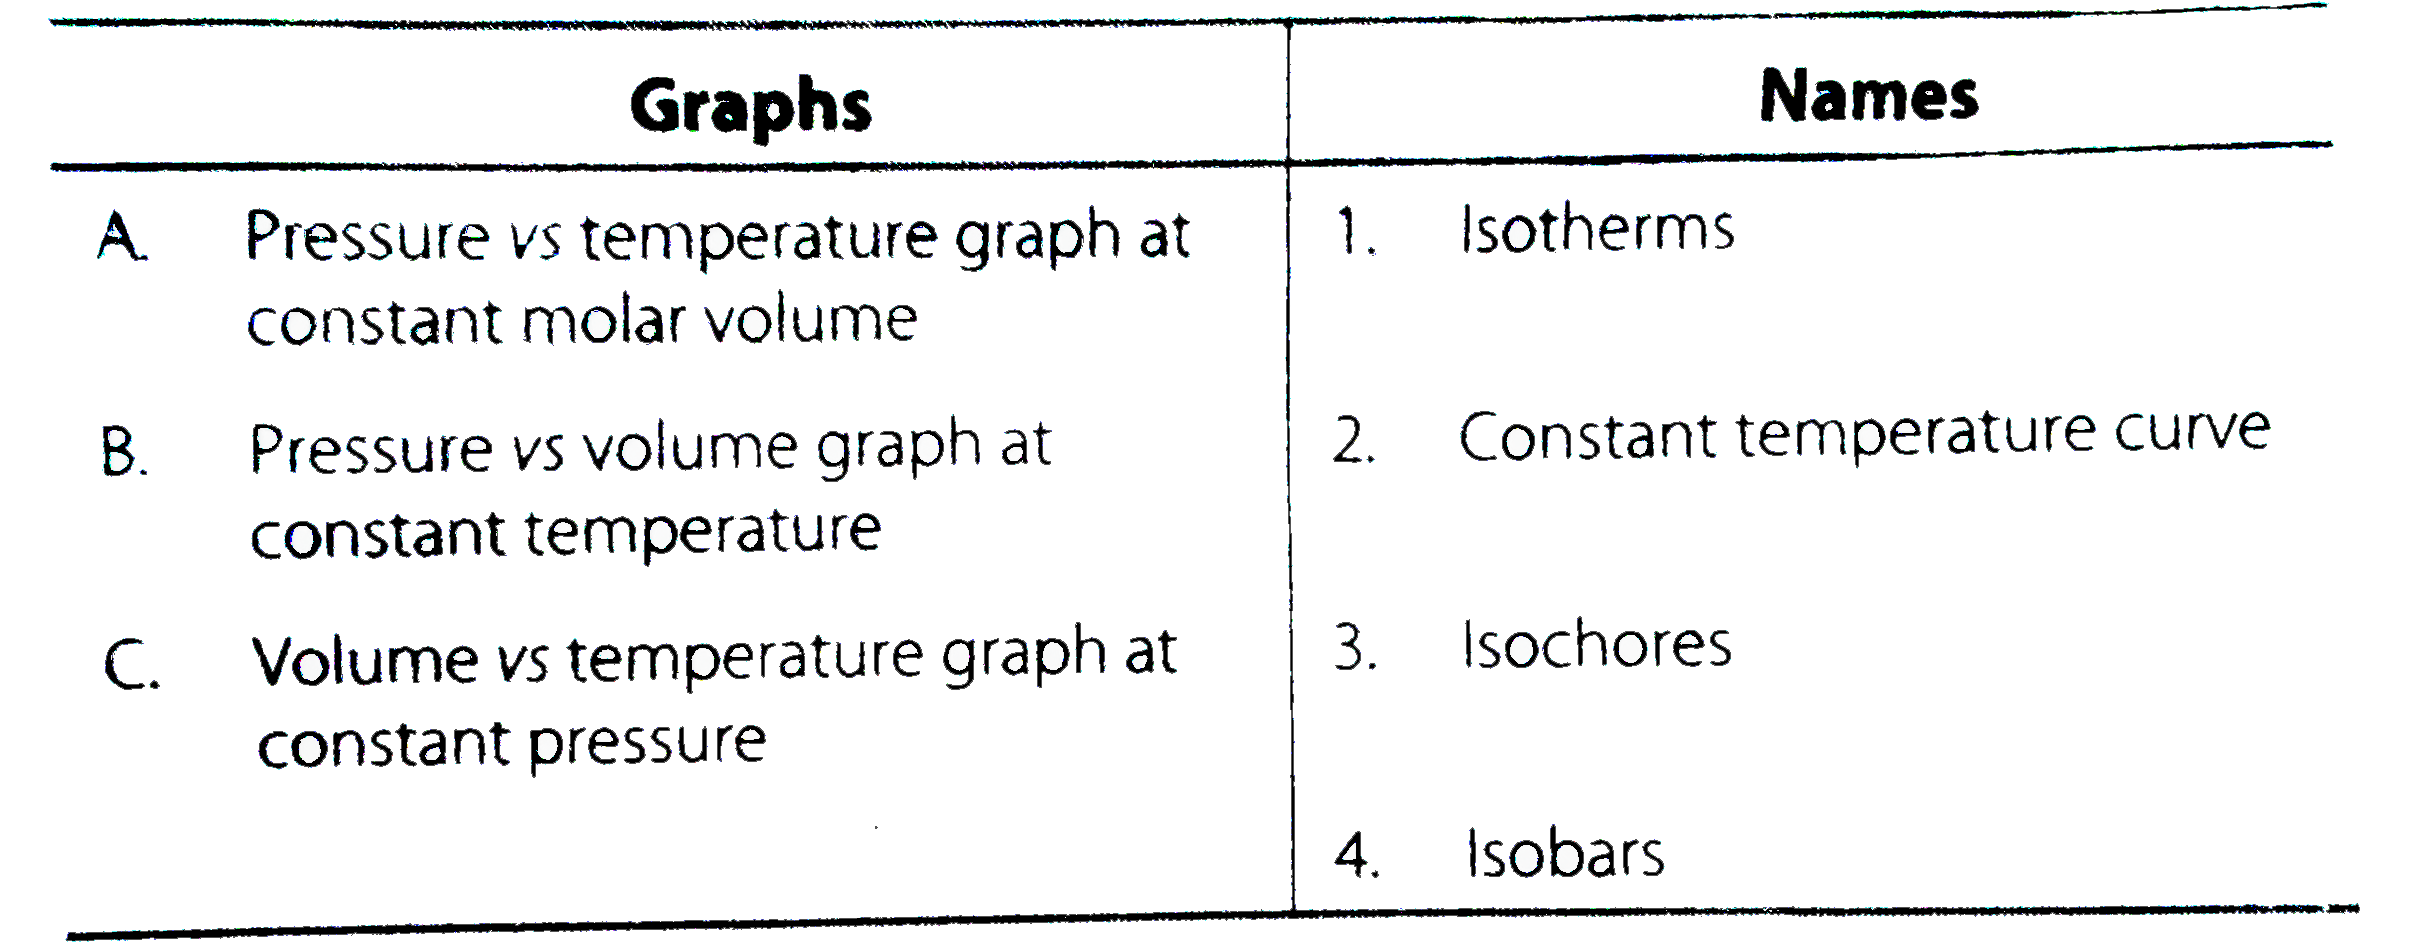
Match the graphs between the following variables with their names.

Text Solution

Verified by Experts

The correct Answer is:
`A. rarr (3) B. rarr (1) C. rarr (4)`

A. when molar volume is constant, the `p-T` graph is called isochore.
B. When temperature is constant, the `p-V` graph is called isotherm.
C. When pressure is constant, `V-T` graph is called isobar.
Doubtnut Promotions Banner Mobile Dark
|

Topper's Solved these Questions

  • STATES OF MATTER

    NCERT EXEMPLAR|Exercise Assertion and Reason|6 Videos
  • STATES OF MATTER

    NCERT EXEMPLAR|Exercise Long Answer Type Question|6 Videos
  • STATES OF MATTER

    NCERT EXEMPLAR|Exercise Short Answer Type Question|23 Videos
  • SOME BASIC CONCEPTS OF CHEMISTRY

    NCERT EXEMPLAR|Exercise All Questions|45 Videos
  • STRUCTURE OF ATOM

    NCERT EXEMPLAR|Exercise All Questions|53 Videos

Similar Questions

Explore conceptually related problems
Match the following graphs of ideal gas with their coordinates.

Match the following graphs of ideal gas with their coordinates :

Knowledge Check

  • Match the following with their name

    A
    Primary structure
    B
    Secondary structure
    C
    Tertiary structure
    D
    Quaternary structure
  • Correlation between two variables is

    A
    Proof of relationship between two variables.
    B
    Simply some pointer of relationship between two variables.
    C
    Neither (a) nor (b)
    D
    Either (a) or (b)
  • Consider the following statements with regard to correlation coefficient r between random variables x and y. I. r=+1 or -1 means there is a linear relationship between the variables. II. -1lerle1 and r^(2) is a measure of the linear relationship between the variables. Which of the statements given above is/are correct?

    A
    Only I
    B
    Only II
    C
    Both I and II
    D
    Neither I nor II
  • Similar Questions

    Explore conceptually related problems

    Match the following amphibians wiith their correct scientific names.

    Refer to the graph in figure. Match the following

    Distinguish between fixed and variable costs

    Correlation between two variables may be

    Correlation between two variables may be