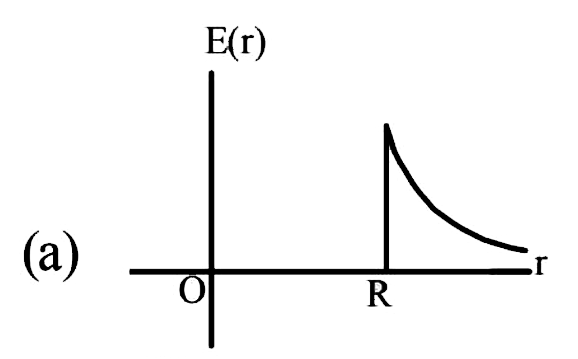
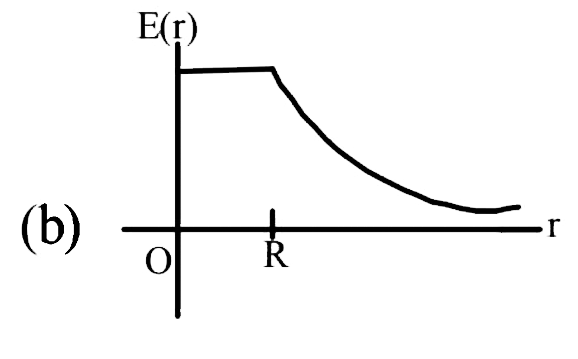
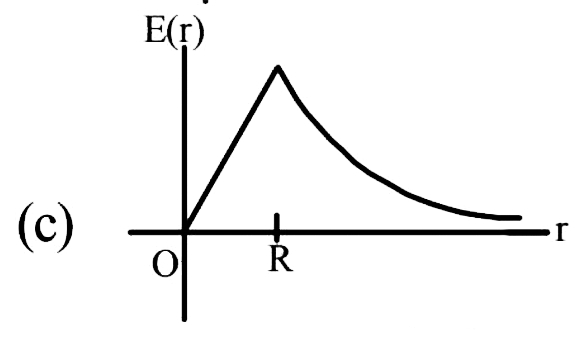
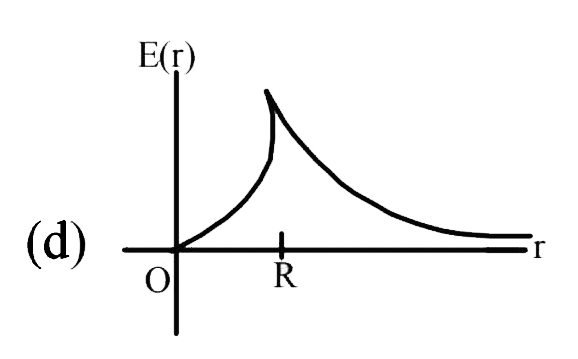
Home
Class 12
PHYSICS
A thin spherical shell of radius R has c...

A thin spherical shell of radius R has charge Q spread uniformly over its surface. Which of the following graphs most closely represents the electric field E(r) produced by the shell in the range `0lerltoo`, where r is the distance from the centre of the shell?

A

(a)

B

(b)

C

(c)

D

(d)

Text Solution

Verified by Experts

The correct Answer is:
A

The electric field inside a thin spherical shell of radius R has charge Q spread uniformly over its surface is zero.

Outside the shell the electric field is `E=k(Q)/(r^2)`. These characteristics are represented by graph(a).
Promotional Banner

Topper's Solved these Questions

  • ELECTROSTATICS

    SUNIL BATRA (41 YEARS IITJEE PHYSICS)|Exercise Subjective Problems|2 Videos
  • ELECTROSTATICS

    SUNIL BATRA (41 YEARS IITJEE PHYSICS)|Exercise Comprehension Based Questions|2 Videos
  • ELECTROMAGNETIC INDUCTION AND ALTERNATING CURRENT

    SUNIL BATRA (41 YEARS IITJEE PHYSICS)|Exercise JEE Main And Advanced|107 Videos
  • MODERN PHYSICS

    SUNIL BATRA (41 YEARS IITJEE PHYSICS)|Exercise MCQ (One Correct Answer|1 Videos

Similar Questions

Explore conceptually related problems

A spherical shell of radius R has a charge +q units. The electric field due to the shell at a point

A spherical shell of radius R has a uniformly distributed charge ,then electric field varies as

A metallic spherical shell of radius R has a charge -Q on it. A point charge +Q is placed at the centre of the shell. Which of the graphs shown below may correctly represent the variation of electric field E with distance r from the centre of shell ?

Which one of the following graphs represents correctly represent the variation of the gravitational field (E) with the distance (r) from the centre of a spherical shell of mass M radius R ?

Conisder a thin spherical shell of radius R with centre at the origin, carrying uniform poistive surface charge denisty. The variation of the magnitude of the electric field |vecE(r)| and the electric potential V(r) with the distance r from the centre, is best represented by which graph?

Which one of the following graphs represents the variation of electric field with distance r from the centre of a charged spherical conductor of radius R?