


Similar Questions
Explore conceptually related problems
Recommended Questions
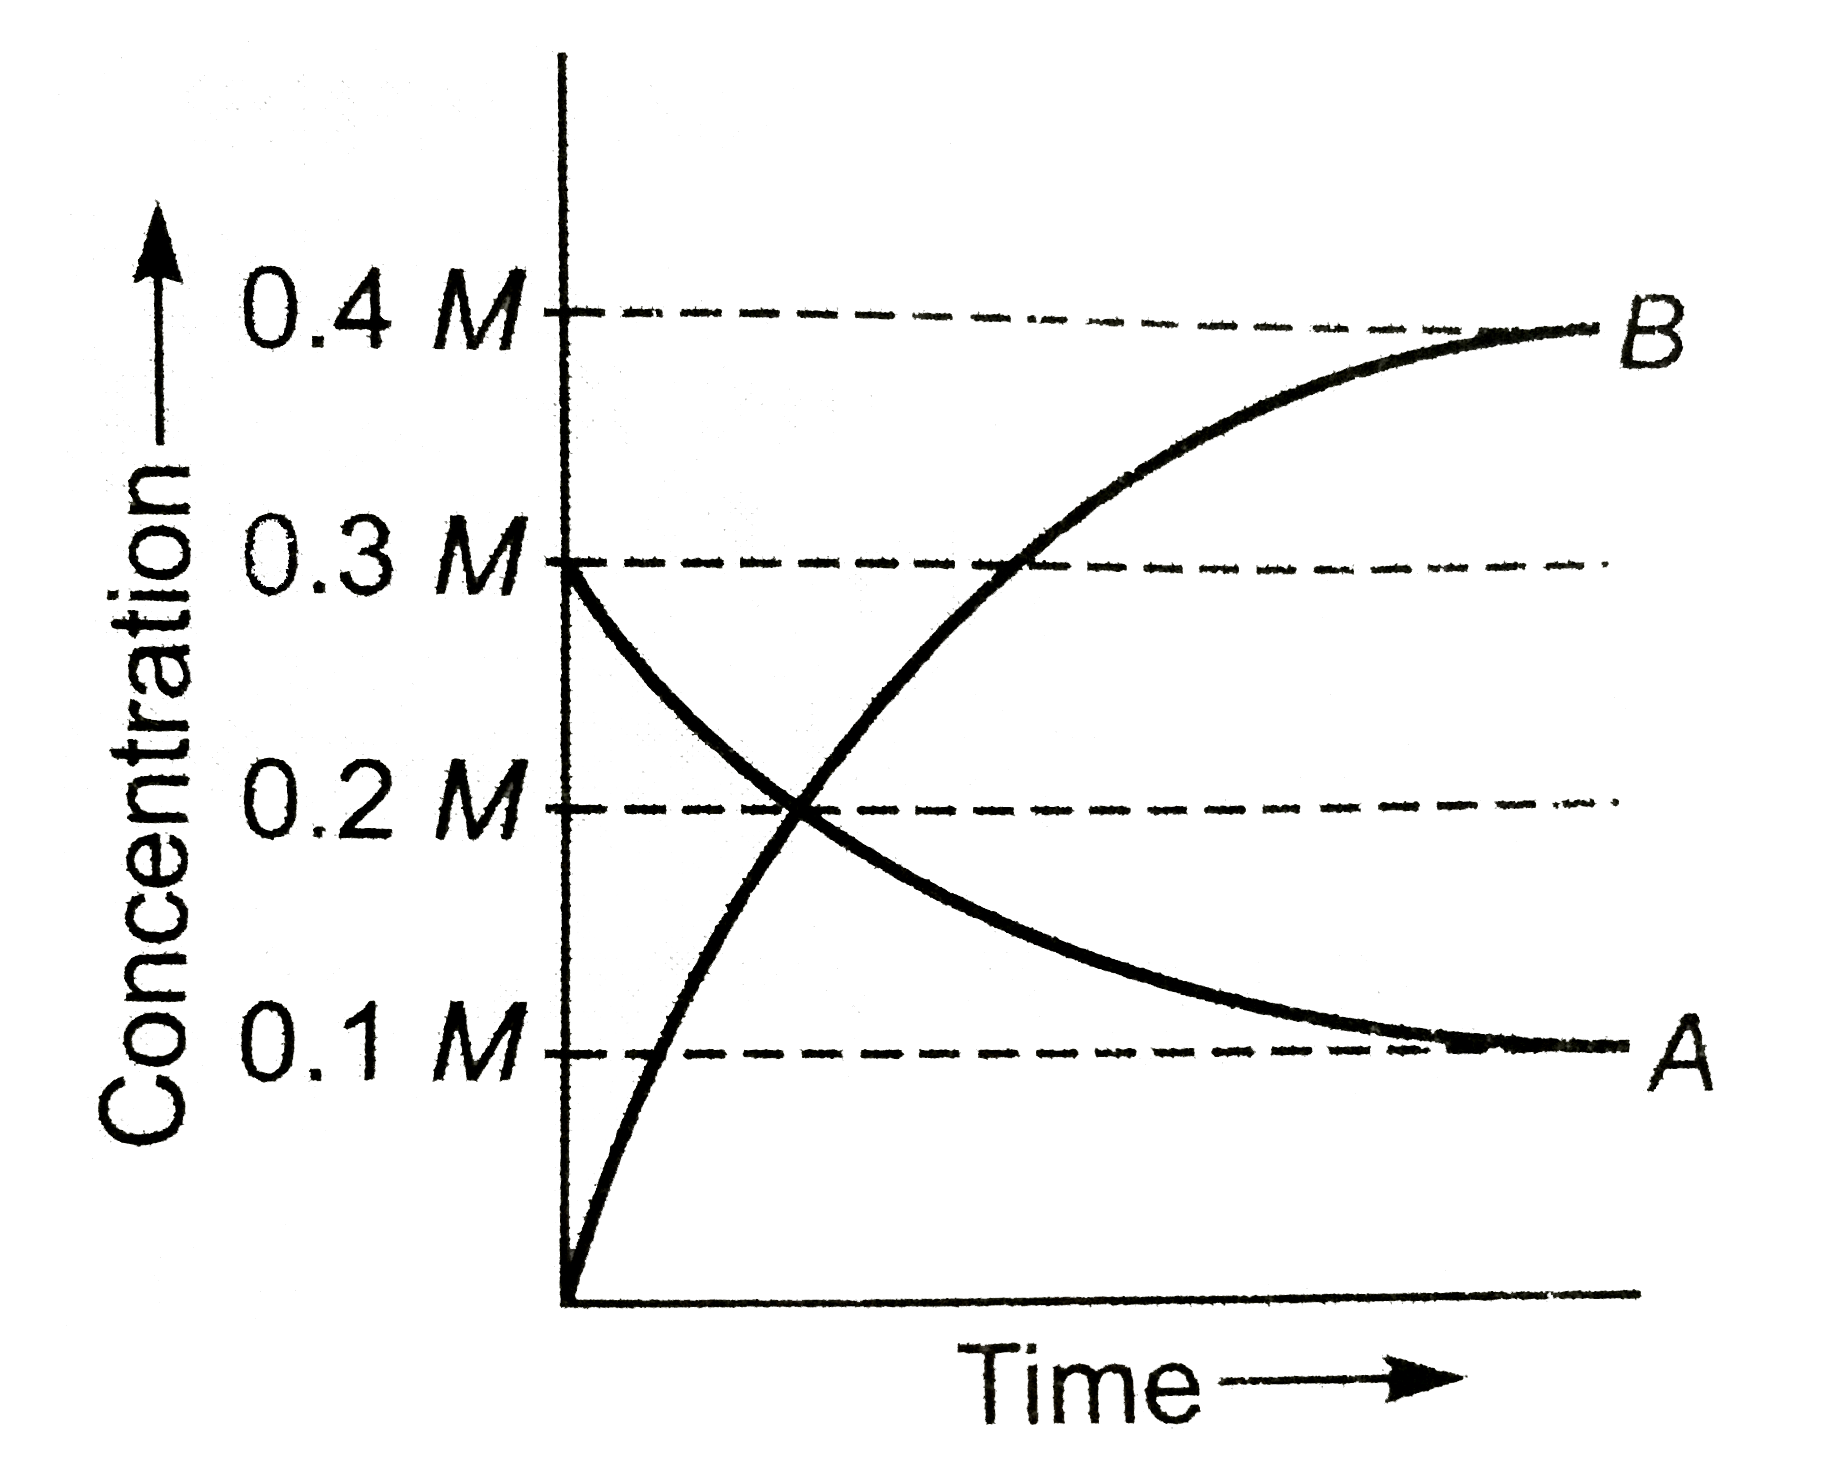
- The figure shows the change in concentration of species A and B as a f...
Text Solution
|
- For the reaction H(2)(g)+I(2)(g) hArr 2HI(g) The equilibrium constant ...
Text Solution
|
- For a reaction A((g)) + B((g))hArrC((g)) + D((g)) the intial concentra...
Text Solution
|
- The following equilibrium exists in a closed vessel in 1L capacity A(g...
Text Solution
|
- For the reaction H(2)(g)+I(2)(g)hArr2HI(g) the equilibrium constant K(...
Text Solution
|
- The figure shows the change in concentration of species A and B as a f...
Text Solution
|
- Consider the general hypothetical reaction A(s)hArr2B(g)+3C(g) If ...
Text Solution
|
- In the equilibrium reaction, A(g) + 2B(g) + (g), the equilibrium const...
Text Solution
|
- For the reaction, A(g)+2B(g)hArr2C(g) one mole of A and 1.5 mol of B a...
Text Solution
|