


Similar Questions
Explore conceptually related problems
Recommended Questions
- The volume V versus temperature T graphs for a cetain amount of a perf...
Text Solution
|
- The volume V versus temperature T graphs for a cetain amount of a perf...
Text Solution
|
- Pressure versus temperature graph of an ideal gas as shown in Fig. Cor...
Text Solution
|
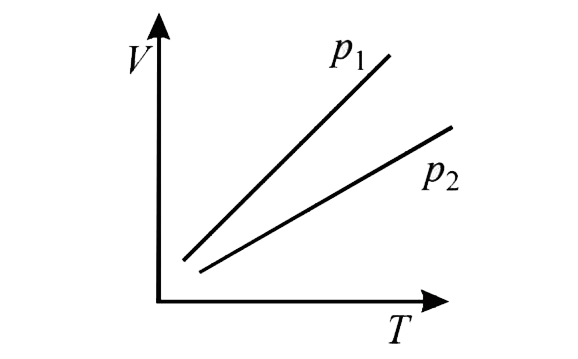
- For V versus T curves at constant pressure P1 and P2 for and ideal gas...
Text Solution
|
- In V-T diagram shown in fig., what is the relation between P1 and P2 ?
Text Solution
|
- Figure 6.18 shows the V-T graph for a fixed mass of an ideal gas at pr...
Text Solution
|
- Mr. A starts a business with an investment of Rs. 28,000. Mr. B joins ...
Text Solution
|
- For an ideal gas V-T curves as constant pressures P1 & P2 are shown in...
Text Solution
|
- Figure shows the volume versus temperature graph for the same mass of ...
Text Solution
|