


Similar Questions
Explore conceptually related problems
Recommended Questions
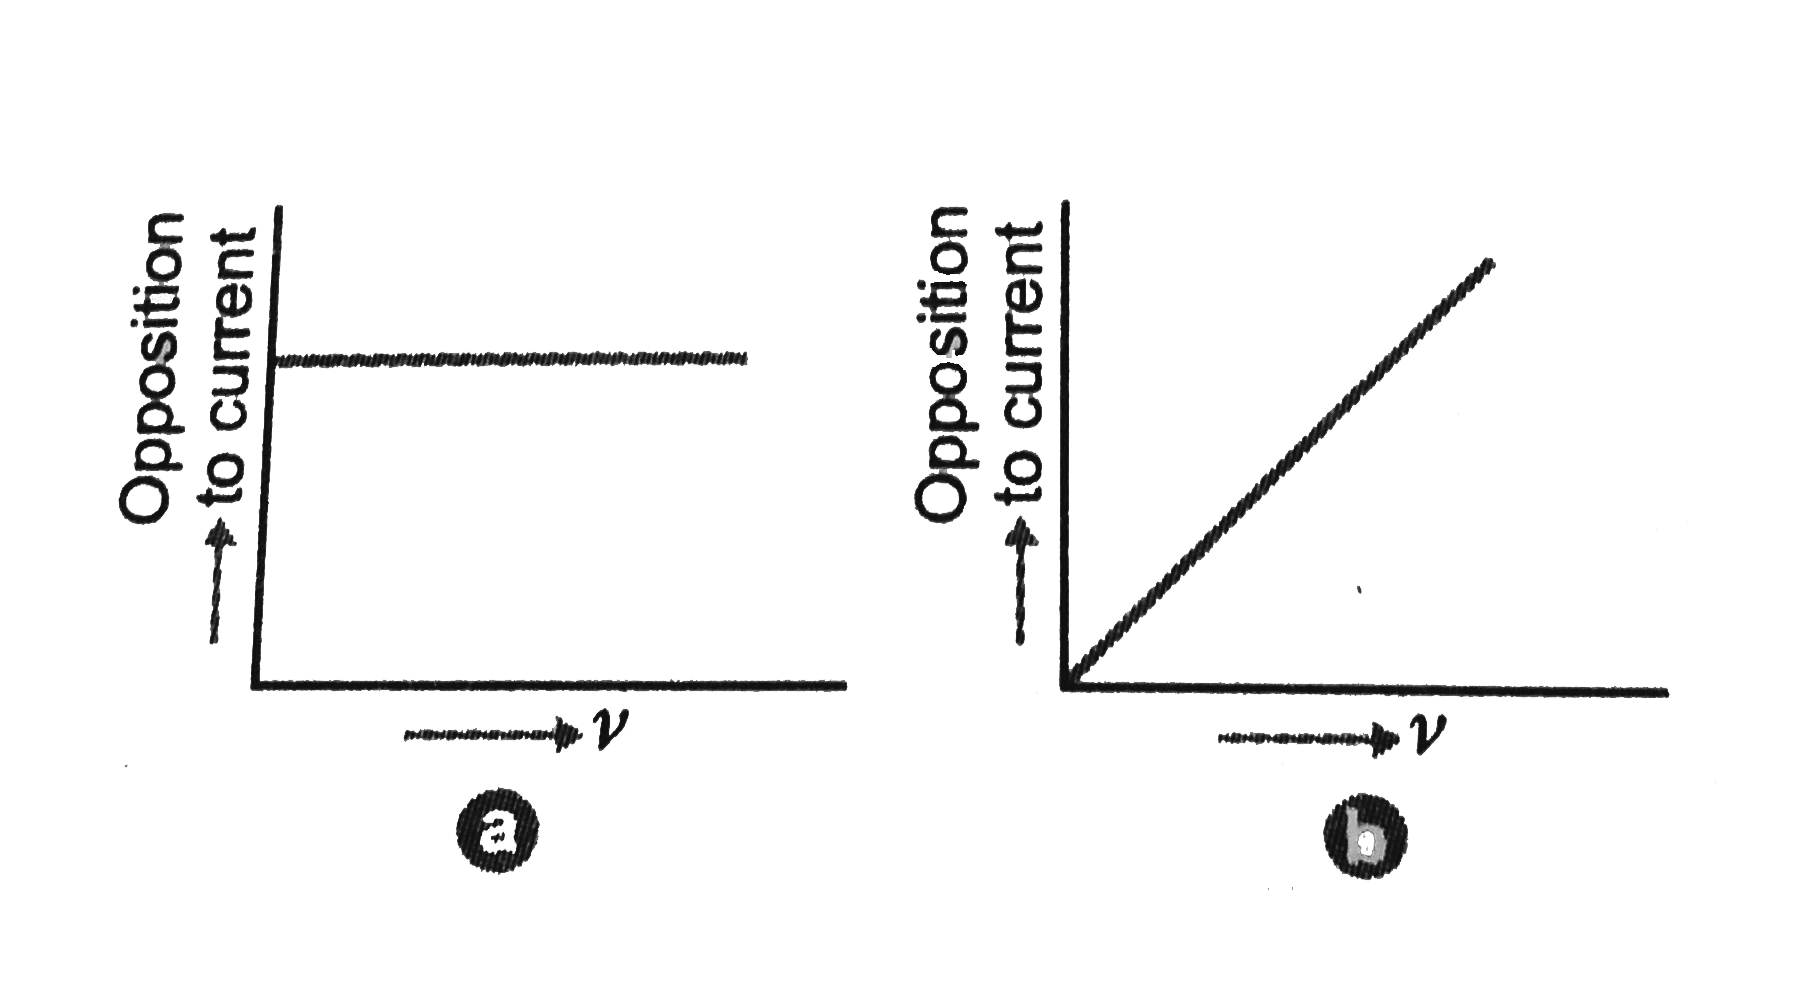
- The graphs shown in Fig. represent the variation of opposition offered...
Text Solution
|
- The graphs shown in Fig. represent the variation of opposition offered...
Text Solution
|
- Sketch a graph showing the variation of impedance of LCR circuit the f...
Text Solution
|
- When a circuit element X is conneted across a.c. source, a current sqr...
Text Solution
|
- An alternating e.m.f. is applied to a series L-C-R circuit. If the fre...
Text Solution
|
- Draw a graph showing the variation of reactance of (i) a capacitor and...
Text Solution
|
- In the circuit shown in fig, the resonant frequency is
Text Solution
|
- An a.c. source of variable angular frequency o is connected to an LCR ...
Text Solution
|
- (a) The graphs (i) and (ii) represent the variation of the opposition ...
Text Solution
|